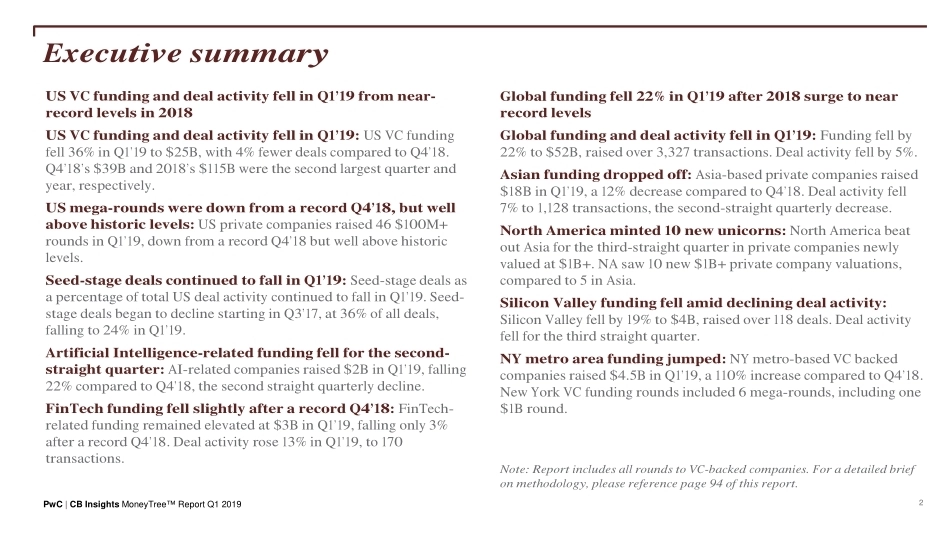
PwC / CB Insights MoneyTree™ ReportQ1 2019每日免费阅读行业报告1、每日星球内分享10+精品报告;2、不定时分享国际投行报告,脱水研报等;3、行业报告均为公开内容,版权归原作者所有,星球仅分享内部学习。扫描右侧二维码即刻加入【行业报告(免费) 】星球(此页只为更多需要行业报告的朋友提供便利,希望不会影响您的阅读,谢谢理解!)PwC | CB Insights MoneyTree™ Report Q1 20192Executive summaryUS VC funding and deal activity fell in Q1’19 from near-record levels in 2018 US VC funding and deal activity fell in Q1’19: US VC funding fell 36% in Q1’19 to $25B, with 4% fewer deals compared to Q4’18. Q4’18’s $39B and 2018’s $115B were the second largest quarter and year, respectively. US mega-rounds were down from a record Q4’18, but well above historic levels: US private companies raised 46 $100M+ rounds in Q1’19, down from a record Q4’18 but well above historic levels. Seed-stage deals continued to fall in Q1’19: Seed-stage deals as a percentage of total US deal activity continued to fall in Q1’19. Seed-stage deals began to decline starting in Q3’17, at 36% of all deals, falling to 24% in Q1’19. Artificial Intelligence-related funding fell for the second-straight quarter: AI-related companies raised $2B in Q1’19, falling 22% compared to Q4’18, the second straight quarterly decline.FinTech funding fell slightly after a record Q4’18: FinTech-related funding remained elevated at $3B in Q1’19, falling only 3% after a record Q4’18. Deal activity rose 13% in Q1’19, to 170 transactions.Global funding fell 22% in Q1’19 after 2018 surge to near record levelsGlobal funding and deal activity fell in Q1’19: Funding fell by 22% to $52B, raised over 3,327 transactions. Deal activity fell by 5%.Asian funding dropped off: Asia-based private companies raised $18B in Q1’19, a 12% decrease compared to Q4’18. Deal activity fell 7% to 1,128 transactions, the second-straight quarterly decrease.North America minted 10 new unicorns: North America beat out Asia for the third-straight quarter in private companies newly valued at $1B+. NA saw 10 new $1B+ private company valuations, compared to 5 in Asia. Silicon Valley funding fell amid declining deal activity: Silicon Valley fell by 19% to $4B, raised over 118 deals. Deal activity fell for the third straight quarter. NY metro area funding jumped: NY metro-based VC backed companies raised $4.5B in Q1’19, a 110% increase compared to Q4’18. New York VC funding rounds included 6 mega-rounds, including one $1B round. Note: Report includes all rounds to VC-backed companies. For a detailed brief on methodology, please reference page 94 of this report.PwC | CB Insights MoneyTree™ Report Q1 2019Table of contents34US Overall Trends74Global Trends59US Movers and Shakers45US Places12US Sector ActivityUS Overall Trends0145PwC | CB Insights MoneyTree™ Report Q3 2017In Q1 2019UNITED STATESVC-backed companies raised$24.6BPwC | CB Insights MoneyTree™ Report Q1 201968-quarter US financing trendUS funding and deal activity decreased in Q1’19•Funding was down 36% in Q1’19 as $24.6B was invested across 1,279 deals. Deal activity declined for the third consecutive quarter. •US-based unicorns brought in noteworthy deals. Flexport, Nuro, and WeWork all raised $900M+ rounds in Q1’19.$19.6$20.8$20.0$22.8$24.5$28.9$38.7$24.61,4731,5611,4341,5241,6391,4271,3281,27902004006008001,0001,2001,4001,6001,800Q2'17Q3'17Q4'17Q1'18Q2'18Q3'18Q4'18Q1'19TitleInvestments ($B)DealsPwC | CB Insights MoneyTree™ Report Q1 20197US financing trends”Over the past three quarters, we’ve seen the number of deals moderate down, while the total amount invested stays relatively consistent.“— Tom Ciccolella, Partner, US Ventures Leader at PwCPwC | CB Insights MoneyTree™ Report Q1 20198US deal share by stageUS seed-stage deals declined after six consecutive down or flat quarters• Seed-stage deals declined to 24% of all deals, their lowest in recent quarters.• Early-stage deals decreased slightly to 26%, their first decrease since Q1’18.30%36%30%30%28%25%25%24%26%24%26%24%24%26%27%26%19%18%19%21%21%22%23%23%9%9%9%9%10%11%10%11%16%14%17%15%17%16%15%16%Q2'17Q3'17Q4'17Q1'18Q2'18Q3'18Q4'18Q1'19Seed StageEarly StageExpansion StageLater StageOtherPwC | CB Insights MoneyTree™ Report Q1 20199Median US deal sizes by stageLater-stage median deal size increased for second consecutive quarter in Q1’19•Median later-stage deal size increased to $40M in Q1’19, an $8M increase from Q3’18, while median deal size shrank to $32M.•Expansion-stage median deal size was flat at $20M.$1.7$1.1$2.0$1.6$2.0$1.5$2.1$2.0$6.0$6.0$7.0$7.0$7.0$6.5$7.4$7.0$15.8$15.5$18.0$16.0$15.5$16.0$20.0$20.0$36.2$30.9$25.0$31.0$44.0$32.0$37.5$40.0Q2'17Q3'17Q4'17Q1'18Q2'18Q3'18Q4'18Q1'19Seed Stage Deal Size ($M)Early Stage Deal Size ($M)Expansion Stage Deal Size ($M)Later Stage Deal Size ($M)PwC | CB Insights MoneyTree™ Report Q1 201910US corporate deal participationCorporate participation in US deals increased to 30%, its highest level in recent quarters•Corporate participation in US deals increased in Q1’19 to 30%, its highest level in recent quarters.76%77%77%76%75%73%73%70%24%23%23%24%25%27%27%30%Q2'17Q3'17Q4'17Q1'18Q2'18Q3'18Q4'18Q1'1...




发表评论取消回复