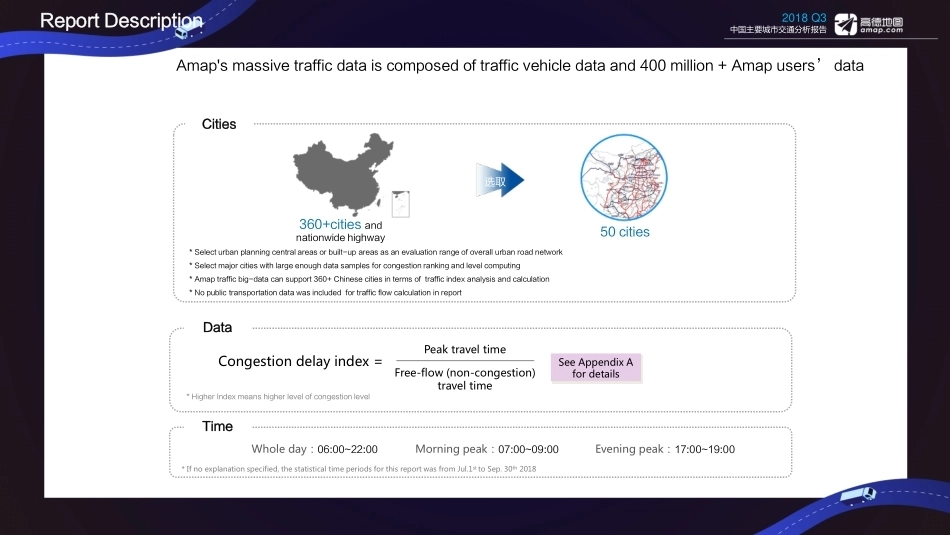
12018 Q3Traffic Analysis Report 2018 Q3中国主要城市交通分析报告• For more information about the data of urban congestion in your city, please visit:http://report.amap.com/• Thanks for your attention, please wait for more research publication coming soonThis research report is made by AutoNavi Traffic Big-data Teamof AutoNavi Software Co., and its entire contents are for referenceonly. The report is made via big data mining and calculation basedon AMAP accumulated massive traffic and travel data. The genericalgorithms and theories ensure its rationality and scientificity. Thereport uses the “congestion delay index” as a metric for urbancongestion, i.e., the ratio of urban residents’ average actual traveltime for one outgoing to their travel time under free flowing. From theperspective of traffic travelers, the index expresses the time costsimposed on travelers due to traffic congestion in a simple andunderstandable way. This report objectively reflects, in multipledimensions, the traffic congestions incities and the solution forrelieving congestions in an as much accurate, detailed and preciseway as possible, which provides valuable theoretical reference forgovernment decision making.The contents in this report, including but not limited to text, data,pictures and logos, are protected by the laws and regulations onintellectual property rights, such as copyright law, patent law andtrademark law, as well as the relevant international treaties. Thisreportis copyrighted by “AutoNavi TrafficData”ofAutoNaviSoftware Co. No institution or individual may reproduce, copy anddistribute this report for business purpose in any form without theprior written permission of AutoNavi. In case any contents in thisreport are citied for non-business purpose, "AutoNavi Traffic Big-data" should be properly presented as the source of such content,and reference, abridgement and modification contrary to the originalintent of the report is strictly prohibited. The report is written inChinese, and its English version is translated from the Chineseversion. In case of any discrepancy between the two versions, theChinese version shall prevail.The Statement 2018 Q3中国主要城市交通分析报告Amap's massive traffic data is composed of traffic vehicle data and 400 million + Amap users’ dataCities360+cities and nationwide highway50 cities* Select urban planning central areas or built-up areas as an evaluation range of overall urban road network* Select major cities with large enough data samples for congestion ranking and level computing* Amap traffic big-data can support 360+ Chinese cities in terms of traffic index analysis and calculation* No public transportation data was included for traffic flow calculation in report 选取Report DescriptionData* Higher Index means higher level of congestion levelSee Appendix A for details* If no explanation specified, the statistical time periods for this report was from Jul.1st to Sep. 30th 2018TimeCongestion delay index =Peak travel timeFree-flow (non-congestion) travel timeWhole day:06:00~22:00 Morning peak:07:00~09:00 Evening peak:17:00~19:002018 Q3中国主要城市交通分析报告4“Traffic Analysis Reports for Major Cities in China” is proposed by AutoNavi, and it is based on Amap traffic big-data publishingplatform, data open platform, Ali cloud MaxCompute and related data mining technology support . The report describes the urbancongestion level, presents the congestion change rules, predicts the future development trend, and focuses on the congestion causesand countermeasures. This first quarterly report is jointly published by “Joint Laboratory for Future Transport and Urban Computing”,Transport Planning and Research Institute of the Ministry of Transport, Tsinghua-Daimler Joint Research Center for SustainableTransportation, Ali Cloud and other organizations. AutoNavi is willing to open our data to governments, enterprises or educationinstitutions, in order to build a traffic community together.Cooperate organization Summary5City Congestion Pattern from Multiple LevelTimeSpaceaverage speedEfficiencycongestion delay indexThe mileage ratio of congestionThe mileage ratio of frequent congested roadThe ratio of peak timestandard deviation coefficient of the peak speed for urban trunkThe index of commute time pressureThe economic loss caused by congestionThe mileage ratio of slow drivingCongestion measure from multiple level…………▋ City Congestion Pattern From Multiple Level —— More Indexes ConsideredUpdate city congestion measures from single index to 9 indexesThe report on this quarter has considered more indexes from just single index to 9 indexes. New indexes include firstly the new time dimension(the ratio of peak time, the index ofcommuter pressure and the economic loss caused by congestion), secondly the new space dimension(the mileage ratio of congestion, the mileage ratio of frequent congested roadand the mileage ratio of slow driving), and thirdly the new efficiency dimension(congestion delay index, average speed and standard deviation coeffic...





发表评论取消回复