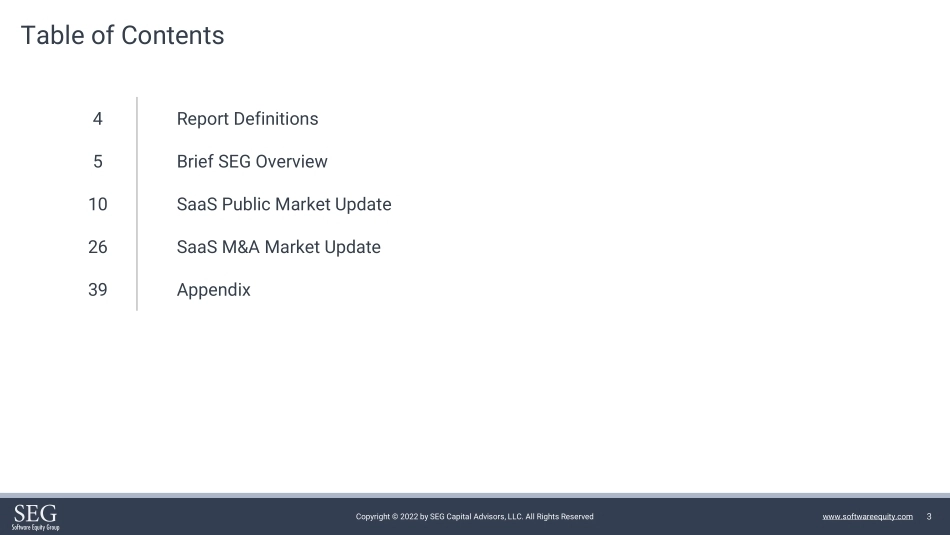
SEG Overview2022 Annual SaaS Reportwww.softwareequity.com2Copyright © 2022 by SEG Capital Advisors, LLC. All Rights Reserved www.softwareequity.comDisclaimer: The information contained in this Report is obtained from sources that SEG Capital Advisors LLC (“SEG”) believes to be reliable. However, SEG makes no representations or warranties, express or implied, about the accuracy, completeness or fairness of such information, or the opinions expressed herein. Nothing in this Report is intended to be a recommendation of a specific security or company or intended to constitute an offer to buy or sell, or the solicitation of an offer to buy or sell, any security. Any person or entity reviewing this report (a) should conduct its own diligence and reach its own conclusions regarding its business transactions, (b) should not rely upon any conclusions reached by SEG, and (c) should consult its own advisors regarding its tax, accounting, financial, and/or business decisions. SEG or its affiliates may have an interest in one or more of the securities or companies discussed herein. Financial data was provided by 451 M&A KnowledgeBase and YCharts.This Report may not be reproduced in whole or in part without the expressed prior written authorization of SEG or one of its affiliates. 3Copyright © 2022 by SEG Capital Advisors, LLC. All Rights Reserved www.softwareequity.com4Report Definitions5Brief SEG Overview10SaaS Public Market Update26SaaS M&A Market Update39AppendixTable of Contents4Copyright © 2022 by SEG Capital Advisors, LLC. All Rights Reserved www.softwareequity.comSaaSPrimarily offers solutions via the cloud and may have a subscription or transaction-based pricing model EVEnterprise ValueTTMTrailing Twelve MonthsYOYYear-Over-Year QOQQuarter-Over-QuarterReport Definitions2022 Annual SaaS ReportBrief SEG Overview6Copyright © 2022 by SEG Capital Advisors, LLC. All Rights Reserved www.softwareequity.comSoftware Equity Group OverviewUnmatched Expertise | Extraordinary Results30+Years of ExperienceBillionsin Aggregate Transaction Value1,000sof Buyer Relationships▪Software Equity Group (SEG) provides unparalleled M&A advisory services for emerging and established B2B software companies ▪Exclusive focus on sell-side advisory services for 30+ years ▪Services include:▪Strategic M&A▪Majority Recapitalizations▪Divestitures▪Board AdvisoryBROAD NETWORK OF SOFTWARE INDUSTRY BUYERS & INVESTORS7Copyright © 2022 by SEG Capital Advisors, LLC. All Rights Reserved www.softwareequity.comSEG’s Sell-Side M&A Transactions in 2021Unannounced TransactionClosed July 2021Unannounced TransactionClosed September 2021Unannounced TransactionClosed December 2021Unannounced TransactionClosed December 20218Copyright © 2022 by SEG Capital Advisors, LLC. All Rights Reserved www.softwareequity.comLeading Sell-Side Advisor to B2B Software Providers21 Sell-Side Transactions Completed in Last 18 Months9Copyright © 2022 by SEG Capital Advisors, LLC. All Rights Reserved www.softwareequity.comSEG M&A StoriesOur business is built on excellent outcomes and enthusiastic client references. SEG M&A Stories are a unique way to gain insight into the M&A process from former SEG clients themselves.York Baur, CEO, MoxiWorksDana Zeff & Steven Ozbun,LeaseLabsAlex Gile, Co-Founder & President, NexternalPaul Lachance, Co-Founder, BigfootDavid Durik, CEO,IndatusChris Atkinson, CEO, Investor Management Services2022 Annual SaaS ReportSaaS Public Market Update11Copyright © 2022 by SEG Capital Advisors, LLC. All Rights Reserved www.softwareequity.com•The median EV/Revenue multiple for the SEG SaaS Index grew an outstanding 20% YOY, reaching a record 14.7x in 2021. •The SEG SaaS Index surpassed $600M in median TTM revenue for the first time as revenue growth spiked to 27.2% in 4Q21. •In 4Q21, SaaS highflyers saw a significant correction in multiples as investors shifted away from riskier high-growth companies that boasted some of the highest multiples in the Index. •While the SaaS Index remains largely unprofitable (-3.1% median EBITDA margin), median free cash flow from operations improved substantially over the last two years (9.7% in 2021 vs. 4.5% in 2019).•Snowflake (99.7x), Bill.com (92.3x), and Cloudflare (90.1x) lead the SEG SaaS Index in terms of EV/Revenue multiples.•Dev Ops & IT Management (17.4x) and Communications & Collaboration (16.5x) continued to lead other product categories in median EV/Revenue multiples in 4Q21.SEG SaaS Index SummaryPlease reach out with any questions or to discuss our relevant market insights. 12Copyright © 2022 by SEG Capital Advisors, LLC. All Rights Reserved www.softwareequity.comADDITIONSREMOVALSIncludes companies that have been added to the Index due to IPO, SPAC acquisition, or transitioned from a license-based model to SaaSIncludes companies that have been removed from the Index due to acquisitionUPCOMING INDEX ADDITIONSIncludes companies that have recently gone public but are excluded from the Index this quarter due to lack of public...




发表评论取消回复