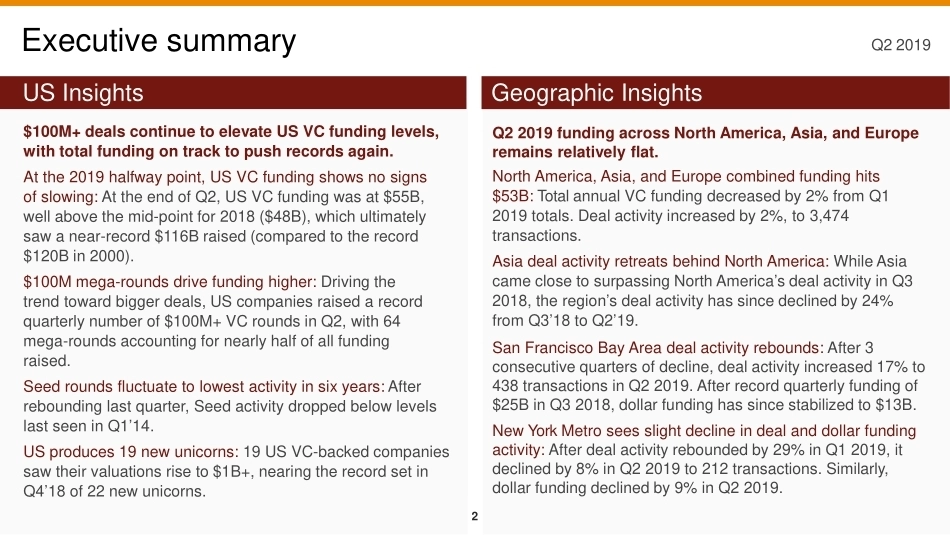
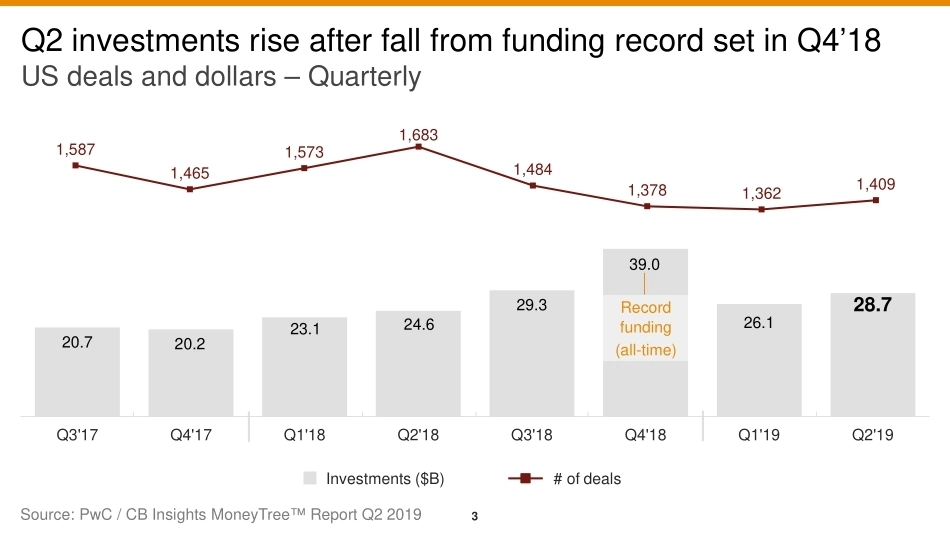
MoneyTree™ ReportQ2 20192Executive summaryQ2 2019$100M+ deals continue to elevate US VC funding levels, with total funding on track to push records again.At the 2019 halfway point, US VC funding shows no signs of slowing: At the end of Q2, US VC funding was at $55B, well above the mid-point for 2018 ($48B), which ultimately saw a near-record $116B raised (compared to the record$120B in 2000). $100M mega-rounds drive funding higher: Driving thetrend toward bigger deals, US companies raised a recordquarterly number of $100M+ VC rounds in Q2, with 64 mega-rounds accounting for nearly half of all funding raised. Seed rounds fluctuate to lowest activity in six years: After rebounding last quarter, Seed activity dropped below levels last seen in Q1’14. US produces 19 new unicorns: 19 US VC-backed companiessaw their valuations rise to $1B+, nearing the record set in Q4’18 of 22 new unicorns. Q2 2019 funding across North America, Asia, and Europeremains relatively flat.North America, Asia, and Europe combined funding hits $53B: Total annual VC funding decreased by 2% from Q1 2019 totals. Deal activity increased by 2%, to 3,474 transactions.Asia deal activity retreats behind North America: While Asia came close to surpassing North America’s deal activity in Q3 2018, the region’s deal activity has since declined by 24% from Q3’18 to Q2’19. San Francisco Bay Area deal activity rebounds: After 3 consecutive quarters of decline, deal activity increased 17% to 438 transactions in Q2 2019. After record quarterly funding of $25B in Q3 2018, dollar funding has since stabilized to $13B.New York Metro sees slight decline in deal and dollar funding activity: After deal activity rebounded by 29% in Q1 2019, it declined by 8% in Q2 2019 to 212 transactions. Similarly, dollar funding declined by 9% in Q2 2019.Geographic InsightsUS InsightsSource: PwC / CB Insights MoneyTree™ Report Q2 201931,5871,4651,5731,6831,4841,3781,3621,40920.720.223.124.629.339.026.128.7Q3'17Q4'17Q1'18Q2'18Q3'18Q4'18Q1'19Q2'19Q2 investments rise after fall from funding record set in Q4’18US deals and dollars – QuarterlyRecord funding (all-time)Investments ($B)# of dealsSource: PwC / CB Insights MoneyTree™ Report Q2 201948,3141,8923,4236,2686,1182,7712019 YTD US funding is strongUS deals and dollars – Annual20102005200020152019 YTD$120$55Recordfunding(all-time)Investments ($B)# of deals$116Record funding(this century)Source: PwC / CB Insights MoneyTree™ Report Q2 201952019 records the largest first half this centuryUS funding – Quarterly seasonality$8.2$12.3$18.9$16.6$16.0$23.1$26.1$9.0$16.9$20.8$18.6$19.7$24.6$28.7$9.1$14.0$20.8$15.8$20.7$29.3$10.1$17.5$17.6$12.1$20.2$39.0Record annual funding(this century)Record first half funding(this century)Q3Q2Q1Q4TotalInvestments ($B):2017201620152014201320182019 YTD$36.4$116.0$76.6$63.1$78.1$60.7$54.8Source: PwC / CB Insights MoneyTree™ Report Q2 20196Seed deal activity fluctuated down to its lowest level in six yearsDeal activity by roundNote: All deals include additional round types1,247All deals55410570330SeriesA113Series C60Series E+1,183364 Seed292Q1 2019Q1 2014Q1 2015Q1 2016Q1 2017Q1 2018Source: PwC / CB Insights MoneyTree™ Report Q2 20197SeriesA$8.0M$2.0M$2.2M SeedOverall median deal size jumped 26% to $7.6M from Q1’19Median deal size by roundOverall$7.6M$26.3M Series C$0.6M$3.8M$9.0MNote: Overall median includes additional round typesQ1 2019Q1 2014Q1 2015Q1 2016Q1 2017Q1 2018Source: PwC / CB Insights MoneyTree™ Report Q2 201983135334855514864Q2’19 saw a record number of $100M+ funding roundsMega-rounds – Investments and deal counts$8.2 $7.6 $7.9 $8.2 $14.6 $24.7 $11.9 $13.4 Q3'17Q4'17Q1'18Q2'18Q3'18Q4'18Q1'19Q2'19Recordmega-rounds(all-time)Recordmega-round investments (all-time)Mega-round investments ($B)# of Mega-roundsNote: Mega-rounds are $100M deals or largerSource: PwC / CB Insights MoneyTree™ Report Q2 2019940%38%34%33%50%63%46%47%Mega-rounds maintain a high percentage of all dealsMega-rounds – Funding and share of deals$8.2 $7.6 $7.9 $8.2 $14.6 $24.7 $11.9 $13.4 $11.5$12.5$12.3$12.3$14.7$15.8$13.9$13.2Q3'17Q4'17Q1'18Q2'18Q3'18Q4'18Q1'19Q2'19Recordmega-round share(all-time)Mega-round investments ($B)Non mega-round investments ($B)Mega-round shareNote: Mega-rounds are $100M deals or largerSource: PwC / CB Insights MoneyTree™ Report Q2 201910US $100M+ rounds are on track to set records againMega-rounds – Quarterly seasonality$1.2$2.9$6.9$4.3$4.4$7.9$11.9$0.9 $4.4 $7.3 $7.4 $7.0 $8.2 $13.4 $0.8 $3.5 $7.8 $4.9 $8.2 $14.6 $1.2 $6.9 $6.2 $2.1 $7.6 $24.7 2013201420152016201720182019 YTDRecord annualmega-round funding(all-time)Record quarterly mega-roundfunding(all-time)$4.1$55.4$27.2$18.7$28.2$17.7$25.3Q3Q2Q1Q4TotalInvestments ($B):Note: Mega-rounds are $100M deals or largerSource: PwC / CB Insights MoneyTree™ Report Q2 201911SectorDealsFunding1Internet$12.0B2Healthcare$4.6B3Mobile & Telecommunications$3.1B4Software (non-internet/mobile)$2.7B5Consumer Products & Services$.7B52132167221620Internet companies ra...




发表评论取消回复