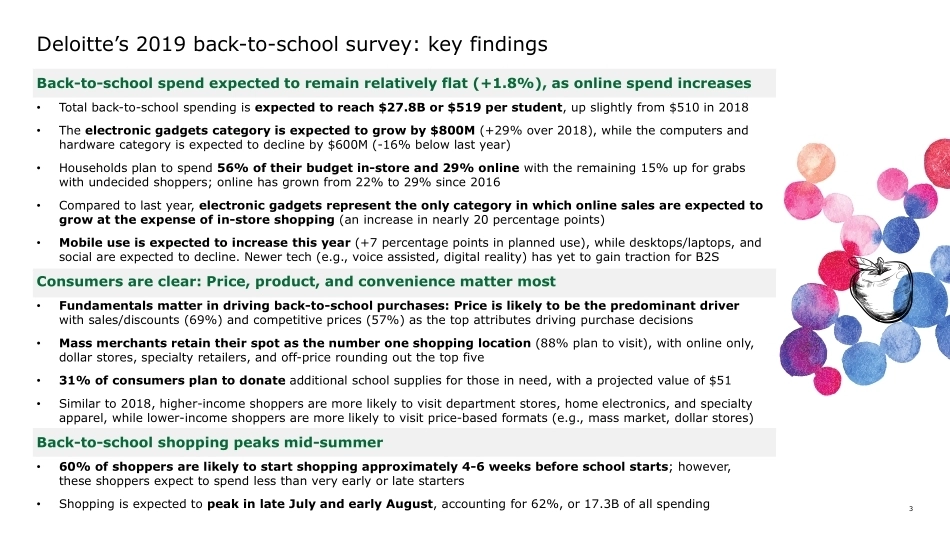
Headline Verdana Bold2019 Back-to-School ShoppingGetting ready for the first day of schoolJuly 20192ContentsKey findings3Back-to-school market size4Consumer spending trends9Back-to-school timing19Digital engagement22Retail type and formats273Back-to-school spend expected to remain relatively flat (+1.8%), as online spend increases•Total back-to-school spending is expected to reach $27.8B or $519 per student, up slightly from $510 in 2018•The electronic gadgets category is expected to grow by $800M (+29% over 2018), while the computers and hardware category is expected to decline by $600M (-16% below last year)•Households plan to spend 56% of their budget in-store and 29% online with the remaining 15% up for grabs with undecided shoppers; online has grown from 22% to 29% since 2016•Compared to last year, electronic gadgets represent the only category in which online sales are expected to grow at the expense of in-store shopping (an increase in nearly 20 percentage points)•Mobile use is expected to increase this year (+7 percentage points in planned use), while desktops/laptops, and social are expected to decline. Newer tech (e.g., voice assisted, digital reality) has yet to gain traction for B2SConsumers are clear: Price, product, and convenience matter most•Fundamentals matter in driving back-to-school purchases: Price is likely to be the predominant driver with sales/discounts (69%) and competitive prices (57%) as the top attributes driving purchase decisions•Mass merchants retain their spot as the number one shopping location (88% plan to visit), with online only, dollar stores, specialty retailers, and off-price rounding out the top five•31% of consumers plan to donate additional school supplies for those in need, with a projected value of $51•Similar to 2018, higher-income shoppers are more likely to visit department stores, home electronics, and specialty apparel, while lower-income shoppers are more likely to visit price-based formats (e.g., mass market, dollar stores)Back-to-school shopping peaks mid-summer•60% of shoppers are likely to start shopping approximately 4-6 weeks before school starts; however, these shoppers expect to spend less than very early or late starters•Shopping is expected to peak in late July and early August, accounting for 62%, or 17.3B of all spendingDeloitte’s 2019 back-to-school survey: key findings4Back-to-school market size5$519average back-to-school spend per student(+1.8% YoY growth from $510 in 2018)Back-to-school (B2S)* shopping season spend, which accounts for 50%+ of annual school-related purchases, expected to remain relatively flat compared with last year29 million households**54 million children***$27.8 billion in projected spending#50%+ annual school-related spending during B2S season^* Back-to-school shopping season includes school-related shopping from July to September, ahead of the Fall 2019 academic calendar** Number of households with school-going (K-12 grades) children in the US [Source: US Current Population Survey 2018]*** Number of children enrolled in K-12 grades in the US [Source: US Current Population Survey 2018]# Percentage of child’s annual school-related products that will likely be purchased during back-to-school shopping season [Source: Deloitte survey]^ Deloitte calculations on back-to-school market spend ($27.8 billion) [Source: Deloitte survey and US Current Population Survey 2018]6Clothing and accessories category is expected to maintain the majority share of spend; the largest increase is expected in electronic gadgets like mobile phones and wearablesEstimated market spend by category - 2019Source: Deloitte calculations on back-to-school market spend ($27.8 billion) [Source: Deloitte survey and US Current Population Survey 2018]Note: Sample size (N) = 1,200*Electronic gadgets include cell phones/smart phones, tablet/e-reader, and wearable devices, voice and mobile data plans, digital subscriptionSchool supplies$6.1BClothing and accessories$15.0B$27.8Best. market sizeComputers and hardware$3.1BElectronic gadgets*$3.6B7Consistent with last year, clothing and accessories has high expected demand and spend; the largest spend per category is expected from electronic gadgetsSource: Deloitte surveyNote: Sample size (N) = 1,200 *Electronic gadgets include cell phones/smart phones, tablet/e-reader, and wearable devices, voice and mobile data plans, digital subscription^Average spend includes only respondents who will purchase the above mentioned category or itemCategoryShare of total B2S spend*Average category spend^% of shoppers purchasingKey category findingsClothing and accessories54%$29097%Represents the majority of back-to-school shopping with both high demand and planned category spendSchool supplies22%$11798%While almost all shoppers expect to purchase supplies, it is the smallest average spendElectronic gadgets13%$30522%Despite lower demand, this category has the highest average spend for those who purchaseComputers and hardware11%$28620%F...





发表评论取消回复