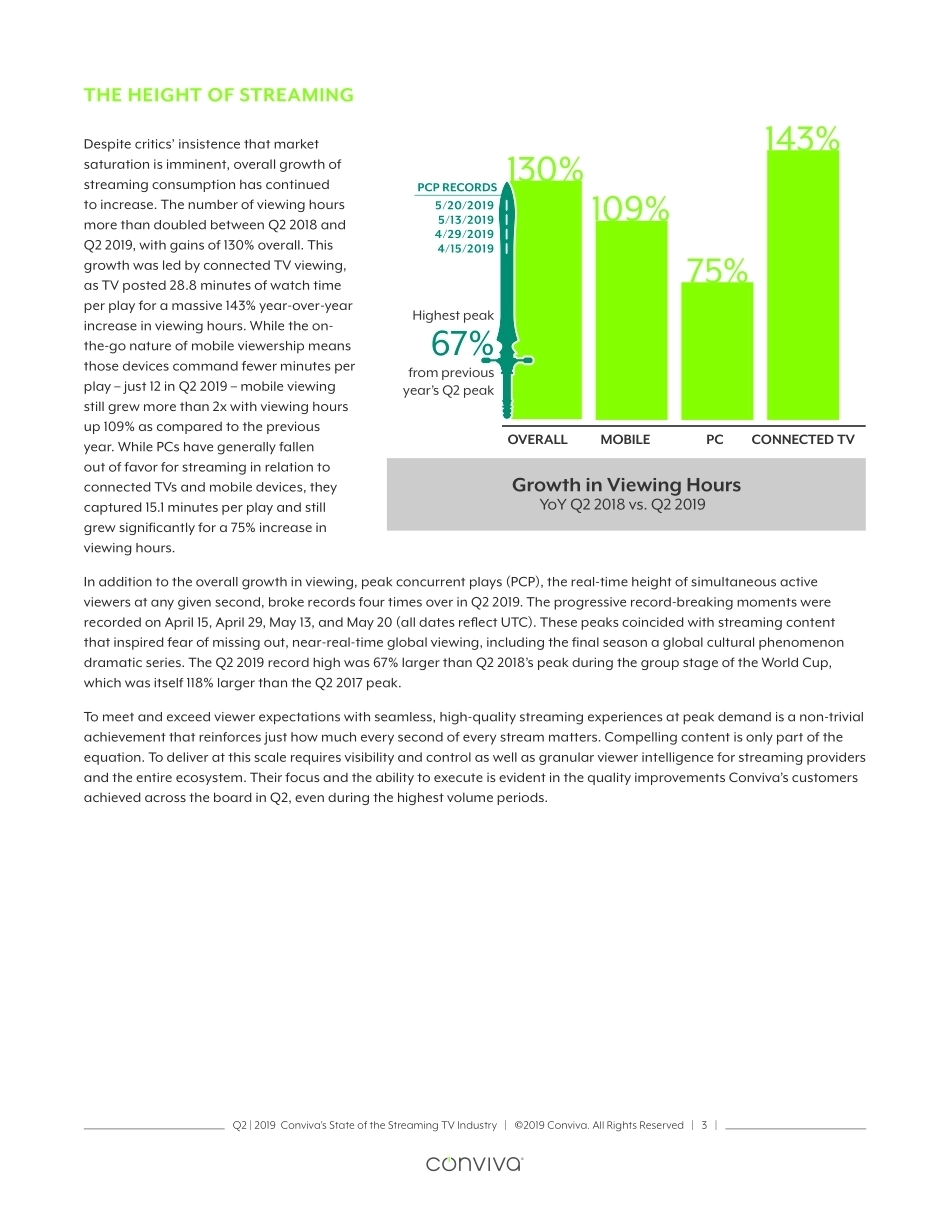
Q2 | 2019 Conviva’s State of the Streaming TV Industry | ©2019 Conviva. All Rights Reserved | 2 |Conviva’s Q2 2019 State of Streaming report reveals new insights into industry shifts and viewer behavior, as well as further exploration into trends highlighted in previous reports. Streaming recorded triple-digit increases in year-over-year viewing, with marked improvements in quality. 2019 is the year of industry consolidations, transitions, and additions of highly anticipated new entrants poised to compete for market share. As competition mounts for streaming providers, imperative to their success will be visibility and actionability upon every aspect of the viewer experience including consumption and quality of content and ads, as well as the influence of social media. In Q2 2019, key takeaways Conviva measured include:• Explosive Viewing Growth: Streaming viewing hours more than doubled with 130% growth year-over-year overall. The industry also achieved significant quality improvements including 42% less buffering.• Hottest Streaming Markets: While major markets dominate overall streaming consumption in the United States, Dallas, Atlanta, and Phoenix are the top 3 cities when consumption is normalized by population. An even bigger surprise: tech hubs of Boston, New York, and San Francisco lag significantly.• Streaming Ad Crisis: Ad buffering is the silent engagement killer. The difference between a viewer making it past the 5% mark in the stream or not is the difference between 0.40% and 1.59% ad buffering on average – a small difference with a critical impact.• Time to Retire the 30-Second Ad?: Streaming ad length still averaged 24.87 seconds in Q2 despite dramatic drops in audience with 20+ second ads. For pre-roll, only 19.0% left during 10 second spots versus 32.6% for ads 20+ seconds. At mid-roll, that delta increased: 29.1% for 10 second ads and 50%+ for ads of 10-20 or 20+ seconds. • Device Wars Rage: The connected TV category led in growth, up 143%. This was largely driven by Roku with 173% growth and an overall 43% share of connected TV viewing. Amazon Fire TV was up 145% in viewing with an 18% share. Apple TV was up 129% to account for 10% share. • Live Bests Video-on-Demand in Quality: The hyper focus on getting it right for live streaming resulted in 13.9% less buffering and 25.6% faster start time than on-demand content, with near equal average picture quality.• Video Rules Social Engagement: Facebook and YouTube saw 15% more videos posted as news media led with the largest growth in average total video views, up 197% year-over-year. Entertainment led in growth of views per video, up 99%.Conviva is the real-time decisioning platform for optimized streaming media. More than 250 industry leaders – including CBS, DAZN, HBO, Hulu, PlayStation™Vue, Sky, Sling TV, Turner, and Univision – rely on Conviva to maximize their consumer engagement, deliver the quality experiences viewers expect, and drive revenue growth. With a global footprint of 100 billion streams per year across 3 billion applications streaming on devices, Conviva offers streaming providers unmatched scale for continuous video measurement, intelligence, and benchmarking across every second of every stream on every screen.Conviva’s data is collected using proprietary sensor technology, which is embedded directly within streaming video applications measuring across content and ads to analyze more than a trillion real-time transactions per day for its customers. In this report, the year-over-year data from Q2 2019 as compared to Q2 2018 was normalized based on Conviva’s customer base.100BSTREAMS PER YEAR3BSTREAMINGAPPLICATIONSDATA EVENTSPER DAY1TTHE STREAMING TV INDUSTRYQ2 | 2019CONVIVA’S STATE OFQ2 | 2019 Conviva’s State of the Streaming TV Industry | ©2019 Conviva. All Rights Reserved | 3 |THE HEIGHT OF STREAMING Despite critics’ insistence that market saturation is imminent, overall growth of streaming consumption has continued to increase. The number of viewing hours more than doubled between Q2 2018 and Q2 2019, with gains of 130% overall. This growth was led by connected TV viewing, as TV posted 28.8 minutes of watch time per play for a massive 143% year-over-year increase in viewing hours. While the on-the-go nature of mobile viewership means those devices command fewer minutes per play – just 12 in Q2 2019 – mobile viewing still grew more than 2x with viewing hours up 109% as compared to the previous year. While PCs have generally fallen out of favor for streaming in relation to connected TVs and mobile devices, they captured 15.1 minutes per play and still grew significantly for a 75% increase in viewing hours.In addition to the overall growth in viewing, peak concurrent plays (PCP), the real-time height of simultaneous active viewers at any given second, broke records four times over in Q2 2019. The progressive record-breaking moments were recorded on April 15, April 29, May 13, and May 20 (all dates reflect UTC). These peaks co...




发表评论取消回复