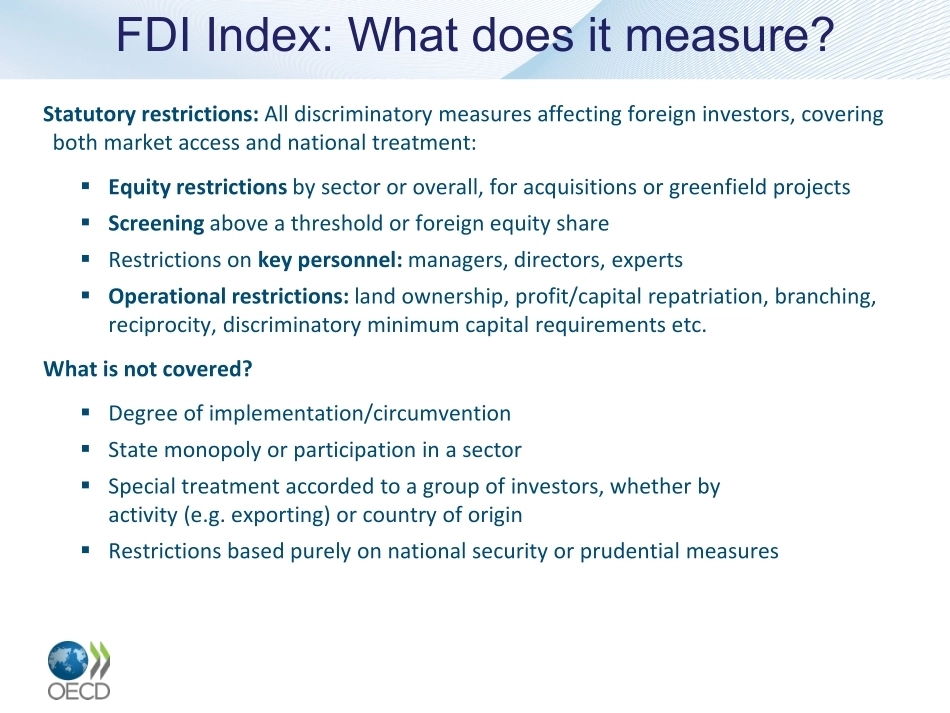
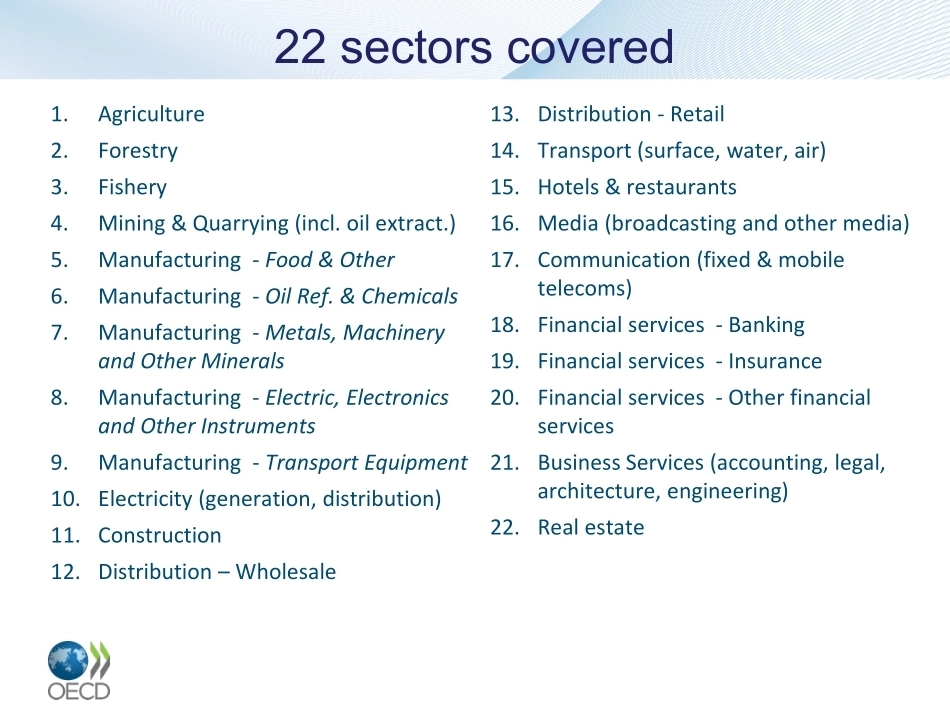
OECD FDI Regulatory Restrictiveness IndexA tool for benchmarking countries, measuring reform and assessing its impactFDI Index: What does it measure?Statutory restrictions: All discriminatory measures affecting foreign investors, covering both market access and national treatment: Equity restrictions by sector or overall, for acquisitions or greenfield projects Screening above a threshold or foreign equity share Restrictions on key personnel: managers, directors, experts Operational restrictions: land ownership, profit/capital repatriation, branching, reciprocity, discriminatory minimum capital requirements etc.What is not covered? Degree of implementation/circumvention State monopoly or participation in a sector Special treatment accorded to a group of investors, whether by activity (e.g. exporting) or country of origin Restrictions based purely on national security or prudential measures1.Agriculture2.Forestry3.Fishery4.Mining & Quarrying (incl. oil extract.)5.Manufacturing - Food & Other6.Manufacturing - Oil Ref. & Chemicals7.Manufacturing - Metals, Machinery and Other Minerals8.Manufacturing - Electric, Electronics and Other Instruments9.Manufacturing - Transport Equipment10. Electricity (generation, distribution)11. Construction12. Distribution – Wholesale13. Distribution - Retail14. Transport (surface, water, air)15. Hotels & restaurants 16. Media (broadcasting and other media)17. Communication (fixed & mobile telecoms)18. Financial services - Banking19. Financial services - Insurance20. Financial services - Other financial services21. Business Services (accounting, legal, architecture, engineering)22. Real estate22 sectors coveredScores built on experts’ assessment of their importanceSimple average of 22 sectorsEqual weights advantage: simple, flexible and easy to useAvoid the pitfall of variations in the index across countries that are due to the variations in the weights used, rather than to the severity of restrictions in placeRESTRICTIONSSCORESI.Foreign equity limitsStart-ups and acquisitionsNo foreign equity allowed1Foreign equity < 50% of total equity0.5Foreign equity > 50% but < 100% of total equity0.25AcquisitionsNo foreign equity allowed0.5Foreign equity < 50% of total equity0.25Foreign equity > 50% but < 100% of total equity0.125II.Screening and approval*Approval required for new FDI/acquisitions of < USD 100mn or if corresponding to < 50% of total equity***0.2 USD100mn or if corresponding to > 50% of total 0.1Notification (pre or post)0.025III. Restrictions on foreign key personnel/directorsForeign key personnel not permitted0.1Economic needs test for employing foreign key 0.05Nationality requirements for board of directors Majority must be nationals0.075 At least one must be national0.02IV. Other restrictionsEstablishment of branches not allowed/local 0.05Reciprocity requirement0.1Restrictions on profit/capital repatriation1.0 - 0.1Access to local finance0.05Land ownership not permitted but leases possible0.05 - 0.01Minimum capital requirement0.05Local content requirements0.1Government procurement offers preference to locally-owned firms0.025Scoring methodologyHow can the FDI Index be used?To measure: relative FDI restrictiveness of each country changes in restrictiveness over time a country’s performance in attracting FDI for a given level of restrictiveness the effect of FDI liberalisation on FDI inflowsFDI Restrictiveness Index, 2018OECD averageNON-OECD average0.000.050.100.150.200.250.300.350.40PhilippinesSaudi ArabiaIndonesiaRussiaMalaysiaChinaJordanNew ZealandIndiaLao PDRMexicoTunisiaIcelandCanadaAustraliaKoreaViet NamUkraineIsraelMyanmarKazakhstanAustriaEgyptUnited StatesBrazilNorwayKyrgyz RepublicSwitzerlandPeruMongoliaPolandMoroccoTurkeySwedenChileSouth AfricaCambodiaJapanItalySlovak RepublicAlbaniaCosta RicaFranceIrelandSerbiaBelgiumUnited KingdomCroatiaDenmarkGreeceArgentinaHungaryBosnia and HerzegovinaMontenegroColombiaGermanyMacedonia, FYRSpainLatviaLithuaniaFinlandEstoniaNetherlandsCzech RepublicRomaniaSloveniaPortugalLuxembourgKosovo*OECD FDI Regulatory Restrictiveness, 2018 (open=0; closed=1)0.000.050.100.150.200.250.300.35Agriculture & ForestryFisheriesMining, Oil & GasManufacturingElectricityConstructionDistributionTransportHotels & restaurantsMediaCommunicationsFinancial servicesBusiness servicesReal estate investmentTotal FDI IndexOECD FDI Regulatory Restrictiveness index (open=0; closed=1)OECDNON-OECDFDI restrictions vary across sectors, 2018Countries with fewer restrictions tend to receive more FDI relative to the size of their economyR² = 0.19110.01.02.03.04.05.06.07.000.050.10.150.20.250.30.350.40.45OECD FDI Regulatory Restrictiveness Index, 2017 (open=0; closed=1)Log of Inward FDI stock to GDP, 2016¹Top reformers, 1997 to 20180.000.100.200.300.400.500.600.700.80Viet NamKoreaChinaIndiaMalaysiaTurkeyIndonesiaFinlandPhilippinesHungaryAustraliaBelgiumCanadaMexicoPolandSloveniaEgyptRussiaSwitzerlandEstoniaAustriaSouth AfricaUnited KingdomGreecePortuga...




发表评论取消回复