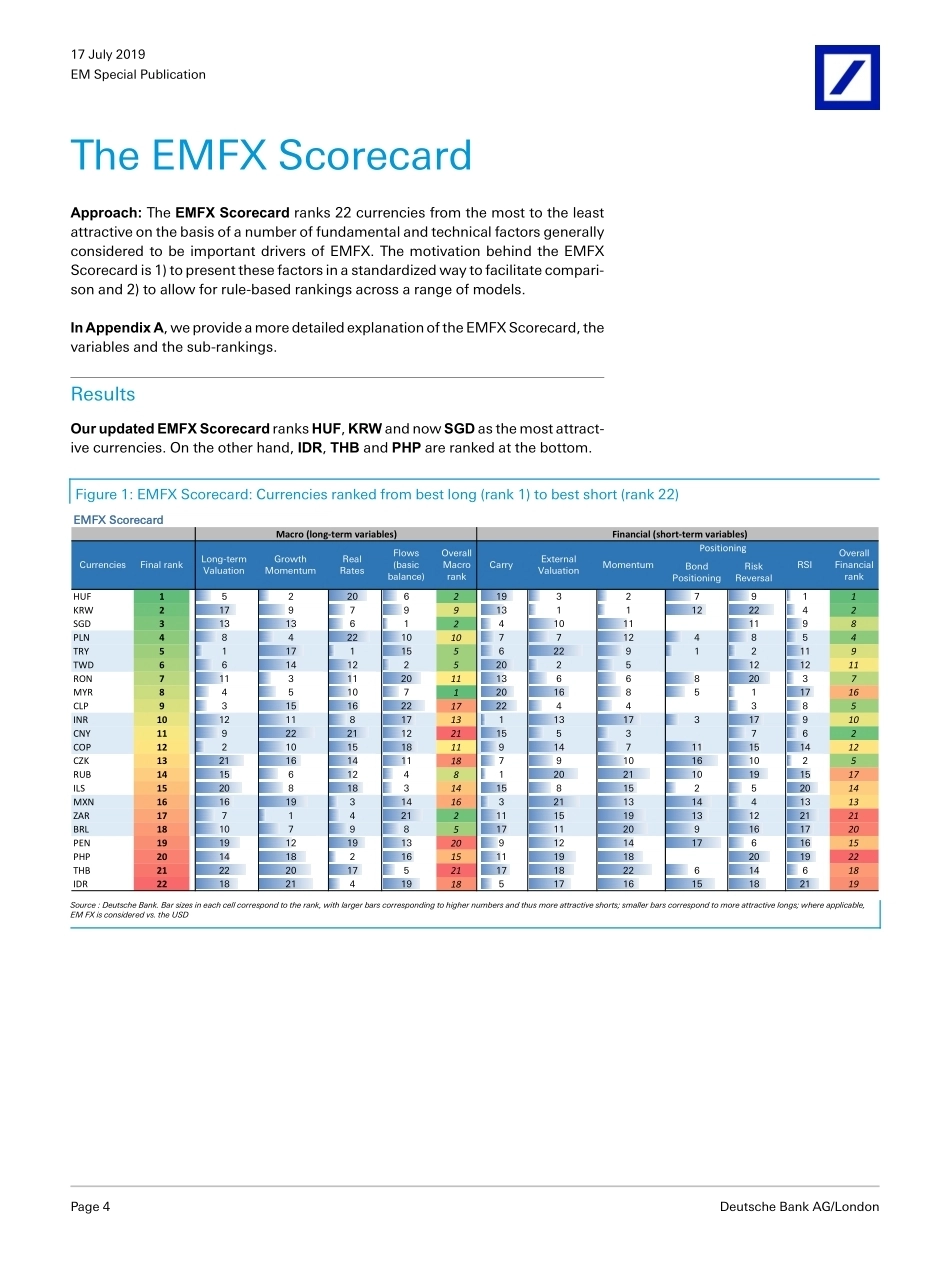
17 July 2019Over the last few days, we have published top-down updates on the attractive-ness of EM local markets. In our publication, EM local markets vs. externals - how much is priced in? , we find that both asset classes – EMFX and EMFI – are at rich levels compared to what is implied by external drivers. This is even more the case for EMFI than EMFX. Furthermore, in our monthly EM Flow report, we point out that over the past few weeks, returns on EM local bonds and EMFX have been noticeably stronger than what are implied by flow indicators. The latter imply very rich valua-tions in local assets relative to those implied by foreign flows.Now in this publication, we provide a bottom-up analysis of EM local markets by updating our EMFX and EMFI Scorecards. We highlight the most attractive FX and Fixed Income markets based on important underlying drivers, and point out changes in attractiveness since the previous edition in early May. Last but not least, we dive deeper into EM local markets and point out where we agree/disagree with the scorecard results.**Please note that within the EMFX and EMFI Scorecards, a weak overall ranking does not necessarily translate into a short on local assets. We present the final score as a simple average of the rankings of individual components. However, we suggest readjusting the weightings depending on the external backdrop (offensive vs defen-sive variables) and the subjective importance of specific variables. Rankings can dif-fer from outstanding trade recommendations.**FindingsnThe EMFX Scorecard: Our updated version ranks HUF, KRW and SGD as the most attractive currencies. On the other hand, PHP, THB and IDR are now ranked among the least attractive currencies. Interestingly, however, we note that based on "Real Rates" and "Carry" – the two variables with the best track records in our most recent EMFX Scorecards – IDR would be ranked among the more attractive currencies, while it is the exact opposite for HUF (the least attractive on those two variables).nCompared to our May publication, INR, PLN and ILS have improved the most in rankings, while COP, BRL and IDR have deteriorated the most.nThe EMFI Scorecard: Similar to May, our updated version once again ranks Malaysia, India and Indonesia among the three most attractive countries, although in a different order this time. On the other hand, the scorecard finds limited value in adding duration exposure in the Czech Republic, Mexico and Chile.Christian WietoskaStrategist+44-20-754-52424David PetitcolinStrategist+44-0-207547-6168Ankit JainResearch Associate+91-22-6181-1634Mallika SachdevaStrategist+65-6423 8947Jundong ZhangMacro Strategist+1-212-250-9363Sebastian A. BrownStrategist+1-212-250-8191Drausio GiacomelliStrategist+1-212-250-7355Deutsche Bank AG/LondonDISCLOSURES AND ANALYST CERTIFICATIONS ARE LOCATED IN APPENDIX 1. MCI (P) 066/04/2019.Deutsche BankResearch Asia Emerging Europe Latin America Emerging Markets EM Special Publication Date Where is the value in EM local markets?Distributed on: 17/07/2019 12:18:11 GMT7T2se3r0Ot6kwoPa17 July 2019EM Special PublicationDeutsche Bank AG/LondonPage 3Table Of ContentsThe EMFX Scorecard..........................................................4Results...............................................................................................................4What has changed from the previous EMFX Scorecard?..................................6Long-term vs. short-term variables....................................................................7The EMFI Scorecard...........................................................8Results...............................................................................................................8What has changed vs the previous EMFI Scorecard?......................................10Long-term vs. short-term variables..................................................................11Evaluating the results.......................................................12FX vs FI Scorecards – where is the value?.......................................................12Scorecard rankings vs performance - a good leading indicator?.....................13Scorecard ranks vs DB Strategy – where do we agree/disagree in EM............15Appendix..........................................................................18Appendix A: EMFX Scorecard – The variables.................................................18Appendix B: EMFI Scorecard – The variables..................................................24Previous EMFI/FX Scorecards - May................................................................3117 July 2019EM Special PublicationPage 4Deutsche Bank AG/LondonThe EMFX ScorecardApproach: The EMFX Scorecard ranks 22 currencies from the most to the least attractive on the basis of a number of fundamental and technical factors generally considered to be important drivers of EMFX. The motivation behind the EMFX Scorecard is 1) to present these factors in...




发表评论取消回复