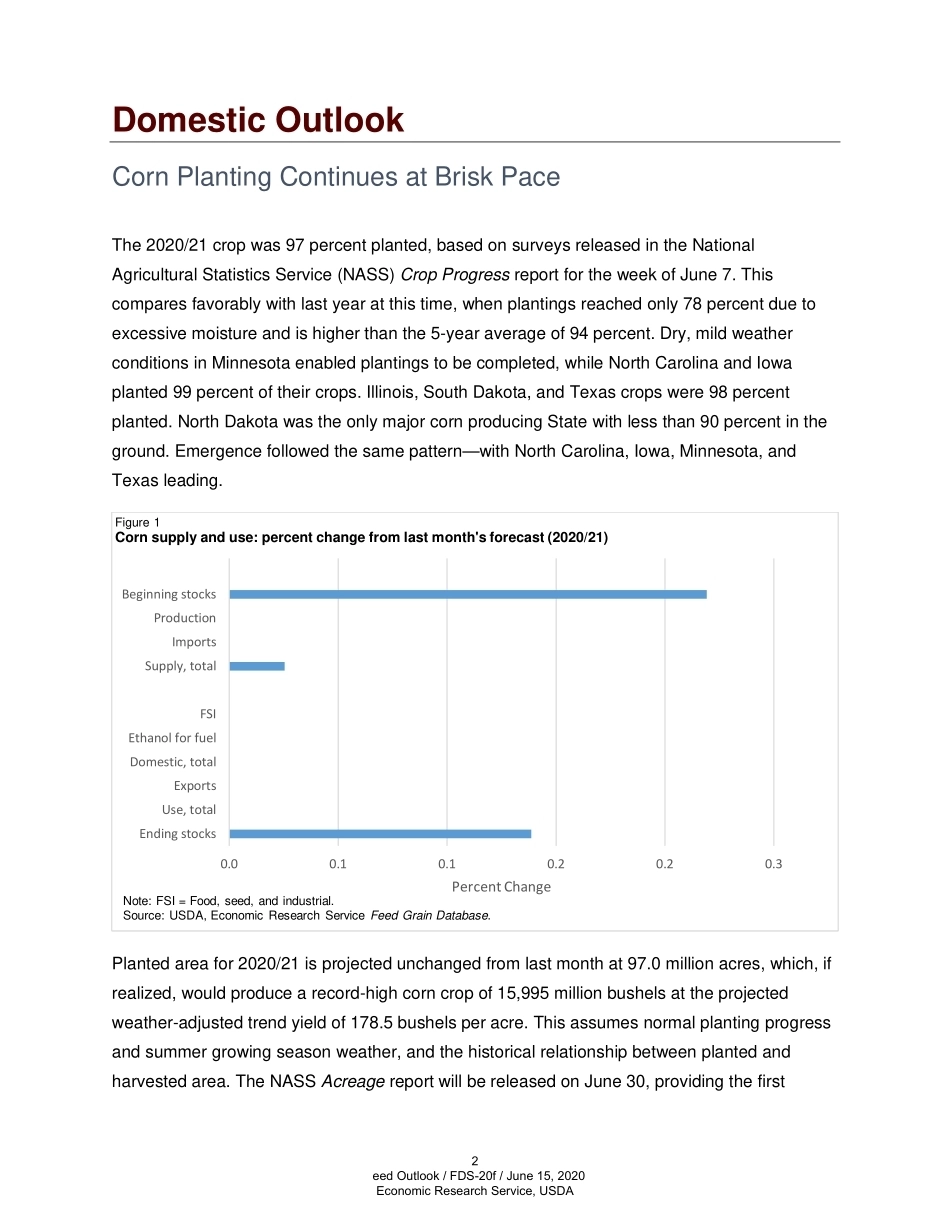
Approved by USDA’s World Agricultural Outlook Board Feed Outlook Tom Capehart Olga Liefert David Olson Lower Corn for Ethanol Reduces 2019/20 Use 2019/20 corn production is projected down 45.4 million bushels on reductions to harvested area and estimated yield. Diminished supply is largely offset by a 50-million-bushel decrease in corn for ethanol this month, for a market year total of 4,900 million bushels. The 50-million-bushel decrease in corn food, seed, and industrial use leaves 2019/20 projected disappearance at 13,780 million bushels. Carryin for 2020/21 is raised 4.6 million bushels. There were a few other minor changes to the feed grains balance sheets and prices are steady from last month. Globally, with higher projected use more than offsetting the marginal increase in supplies, 2020/21 coarse grain ending stocks are projected down this month. Corn trade for 2019/20 involves two offsetting changes, with higher Argentine and lower Brazilian exports. China’s punitive tariffs affect the barley market, reducing Australian exports and leaving Australia with higher barley supplies in the face of better crop prospects. Economic Research Service | Situation and Outlook Report Next release is July 14, 2020 FDS-20f | June 15, 2020In this report: Domestic Outlook International Outlook Domestic Outlook Corn Planting Continues at Brisk Pace The 2020/21 crop was 97 percent planted, based on surveys released in the National Agricultural Statistics Service (NASS) Crop Progress report for the week of June 7. This compares favorably with last year at this time, when plantings reached only 78 percent due to excessive moisture and is higher than the 5-year average of 94 percent. Dry, mild weather conditions in Minnesota enabled plantings to be completed, while North Carolina and Iowa planted 99 percent of their crops. Illinois, South Dakota, and Texas crops were 98 percent planted. North Dakota was the only major corn producing State with less than 90 percent in the ground. Emergence followed the same pattern—with North Carolina, Iowa, Minnesota, and Texas leading. Planted area for 2020/21 is projected unchanged from last month at 97.0 million acres, which, if realized, would produce a record-high corn crop of 15,995 million bushels at the projected weather-adjusted trend yield of 178.5 bushels per acre. This assumes normal planting progress and summer growing season weather, and the historical relationship between planted and harvested area. The NASS Acreage report will be released on June 30, providing the first 0.00.10.10.20.20.3Ending stocksUse, totalExportsDomestic, totalEthanol for fuelFSISupply, totalImportsProductionBeginning stocksPercent ChangeNote: FSI = Food, seed, and industrial. Source: USDA, Economic Research Service Feed Grain Database.Figure 1Corn supply and use: percent change from last month's forecast (2020/21)2 Feed Outlook / FDS-20f / June 15, 2020 Economic Research Service, USDAnQtPpNuMzR7NdN9PnPoOtRmMkPqQqOfQqRrO6MpOtNNZmPyQMYpPsOsurvey-based area estimate for the 2020/21 corn crop, based primarily on data collected in the first 2 weeks of June. Supplies at this level of production would be 18,123 million bushels, given a projected carryin of 2,103 million bushels and imports of 25 million. There is no change in projected use for 2020/21. The 4.6-million-bushel reduction in carryin from 2019/20 is passed through to ending stocks of 3,323 million bushels. The season average price received by farmers is unchanged from last month at $3.20 per bushel. 02040608010012014016018020001020304050607080901001988 91/92 94/95 97/98 00/01 03/04 06/07 09/10 12/13 15/16 18/19Bushels/acreMillion acresFigure 2U.S. corn harvested area and yieldSources: USDA, Economic Research Service with data from National Agricultural Statistics Service, QuickStats, and USDA, World Agricultural Outlook Board, Crop Projections, 2020.Harvested area (left axis)Yield (right axis)151101151201251Jan-15Apr-15Jul-15Oct-15Jan-16Apr-16Jul-16Oct-16Jan-17Apr-17Jul-17Oct-17Jan-18Apr-18Jul-18Oct-18Jan-19Apr-19Jul-19Oct-19Jan-20Apr-20Dollars/short tonNo. 2 yellow cornDDGS Cent ILSource: USDA, Economic Research Service (ERS) using data from the ERS Feed Grains Database and USDA, Agricultural Marketing Services.Figure 3Monthly prices for Central Illinois no. 2 yellow corn and corn distillers dried grain3 Feed Outlook / FDS-20f / June 15, 2020 Economic Research Service, USDA The 2019/20 crop is estimated 45.4 million bushels lower. Yield is lowered 0.4 bushels per acre to 167.4 million bushels. Resulting supply is 15,883 million bushels. 123456789Jan-12Jan-13Jan-14Jan-15Jan-16Jan-17Jan-18Jan-19Jan-20Dollars/bushelSorghumCornSources: USDA, Economic Research Service, Feed Grains Database and USDA, Agricultural Marketing Service.Figure 4Monthly #2 grain sorghum and yellow corn prices for Kansas City -1.2-1.0-0.8-0.6-0.4-0.20.00.20.4Ending stocksUse, totalExportsDomestic, totalEthanol for fuelFSISupply, totalImportsProductionBeginning stocksPercent...





发表评论取消回复