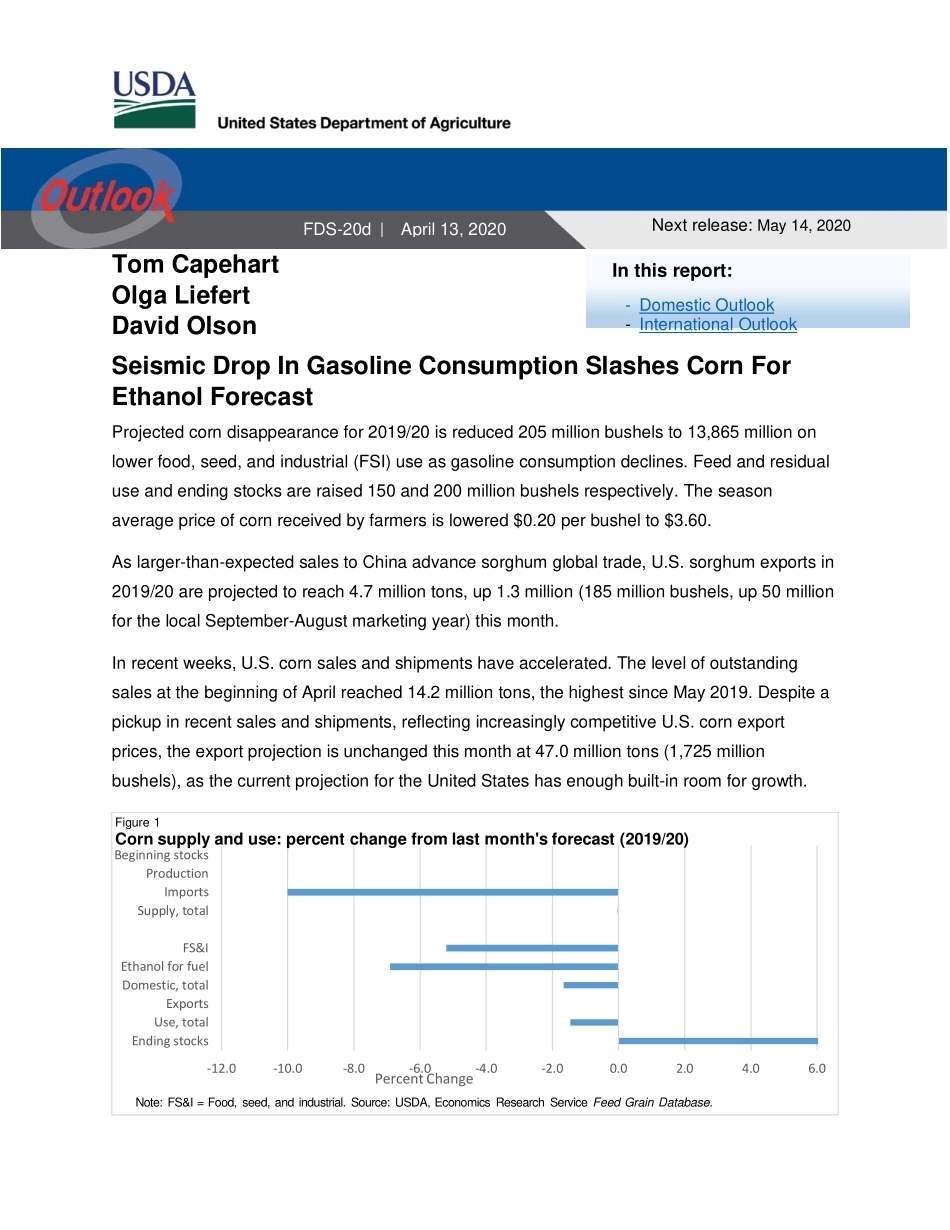
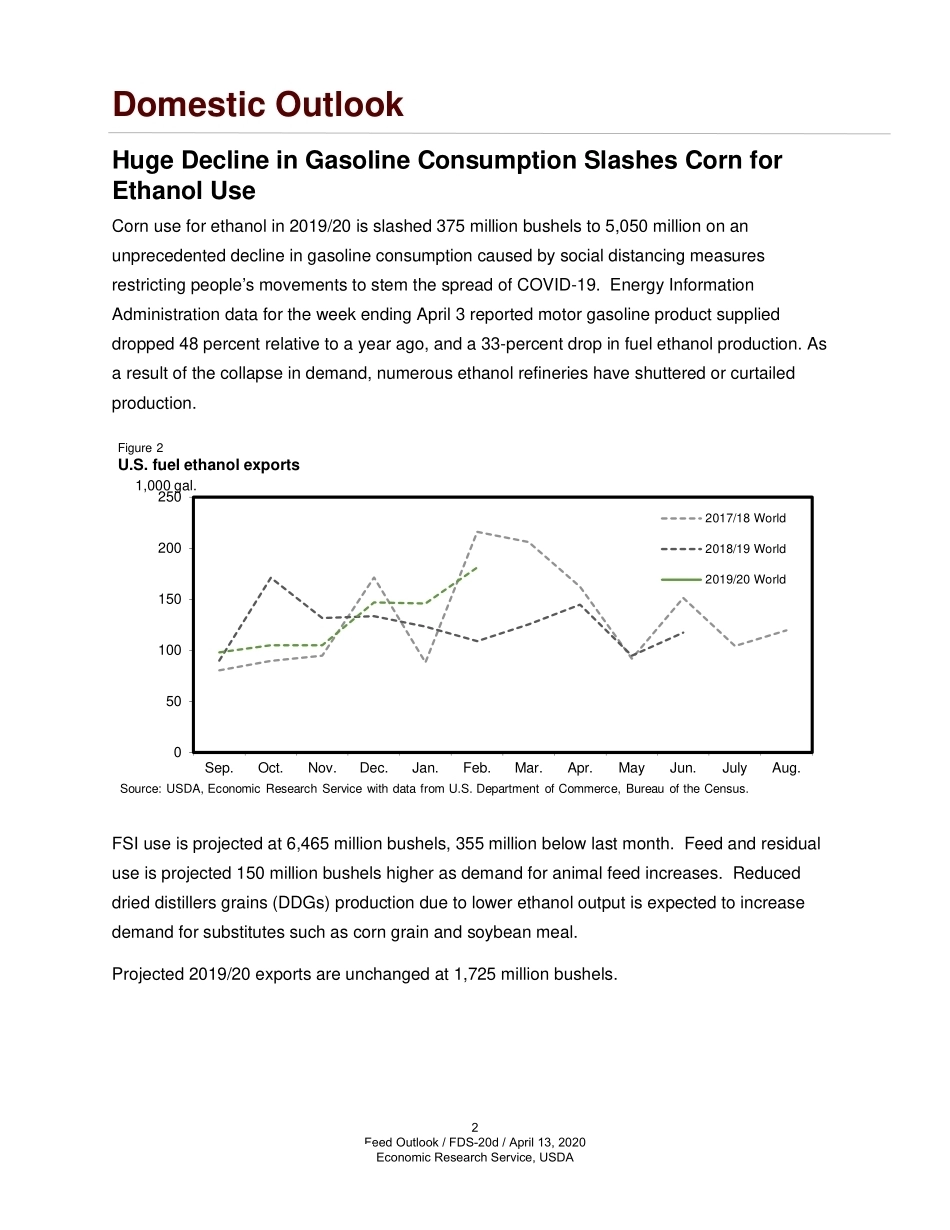
Feed Outlook Tom Capehart Olga Liefert David Olson Seismic Drop In Gasoline Consumption Slashes Corn For Ethanol Forecast Projected corn disappearance for 2019/20 is reduced 205 million bushels to 13,865 million on lower food, seed, and industrial (FSI) use as gasoline consumption declines. Feed and residual use and ending stocks are raised 150 and 200 million bushels respectively. The season average price of corn received by farmers is lowered $0.20 per bushel to $3.60. As larger-than-expected sales to China advance sorghum global trade, U.S. sorghum exports in 2019/20 are projected to reach 4.7 million tons, up 1.3 million (185 million bushels, up 50 million for the local September-August marketing year) this month. In recent weeks, U.S. corn sales and shipments have accelerated. The level of outstanding sales at the beginning of April reached 14.2 million tons, the highest since May 2019. Despite a pickup in recent sales and shipments, reflecting increasingly competitive U.S. corn export prices, the export projection is unchanged this month at 47.0 million tons (1,725 million bushels), as the current projection for the United States has enough built-in room for growth. -12.0-10.0-8.0-6.0-4.0-2.00.02.04.06.0Ending stocksUse, totalExportsDomestic, totalEthanol for fuelFS&ISupply, totalImportsProductionBeginning stocksPercent ChangeNote: FS&I = Food, seed, and industrial. Source: USDA, Economics Research Service Feed Grain Database. Figure 1Corn supply and use: percent change from last month's forecast (2019/20)Approved by the World Agricultural Outlook Board. FDS-20d | April 13, 2020Next release: May 14, 2020 In this report: - Domestic Outlook- International OutlookDomestic Outlook Huge Decline in Gasoline Consumption Slashes Corn for Ethanol Use Corn use for ethanol in 2019/20 is slashed 375 million bushels to 5,050 million on an unprecedented decline in gasoline consumption caused by social distancing measures restricting people’s movements to stem the spread of COVID-19. Energy Information Administration data for the week ending April 3 reported motor gasoline product supplied dropped 48 percent relative to a year ago, and a 33-percent drop in fuel ethanol production. As a result of the collapse in demand, numerous ethanol refineries have shuttered or curtailed production. FSI use is projected at 6,465 million bushels, 355 million below last month. Feed and residual use is projected 150 million bushels higher as demand for animal feed increases. Reduced dried distillers grains (DDGs) production due to lower ethanol output is expected to increase demand for substitutes such as corn grain and soybean meal. Projected 2019/20 exports are unchanged at 1,725 million bushels. 050100150200250Sep.Oct.Nov.Dec.Jan.Feb.Mar.Apr.MayJun.JulyAug.Figure 2U.S. fuel ethanol exports 2017/18 World2018/19 World2019/20 WorldSource: USDA, Economic Research Service with data from U.S. Department of Commerce, Bureau of the Census.1,000 gal.2Feed Outlook / FDS-20d / April 13, 2020Economic Research Service, USDAmRtPmOzRvNbR9R6MnPpPnPqQlOnNmQkPqRsObRrQtNxNtPmONZtQqPCorn Stocks Point to Higher Second Quarter Disappearance March 1 corn stocks reported by the National Agricultural Statistics Service (NASS)’ Grain Stocks are 7,953 million bushels and indicate December-February disappearance of 3,617 million bushels compared with 3,332 million for the same period last year. For the first half of the marketing year (September-February) disappearance is 7,978 million bushels compared with 7,874 million last year. Feed and residual accounted for most of the increase. 02468101214161888/8991/9294/9597/9800/0103/0406/0709/1012/1315/1618/19Feed and residualExportsOther food, seed, and industrial usesEthanolEnding stocksNote: Marketing year 2018/19 and 2019/20 are projected.Source: USDA, World Agricultural Outlook Board, WASDE. Figure 3 U.S. corn utilizationBillion bu1.01.52.02.53.03.54.04.55.05.56.06.57.07.58.08.5Sep.Oct.Nov.Dec.Jan.Feb.Mar.Apr.MayJun.JulyAug.2016/172017/182018/192019/20Source: USDA, Economic Research Service with data U.S. Department of Commerce, Bureau of the Census, January 2020 Grain Inspections.Million metric tonsFigure 4Monthly U.S. corn exports3 Feed Outlook / FDS-20d / April 13, 2020 Economic Research Service, USDAFarmer Corn-Planting Intentions Up 8 Percent From 2019 The NASS Prospective Plantings indicated farmers intend to plant 97.0 million acres of corn for the 2020/21 marketing year, 8 percent or 7.3 million acres over last year’s plantings of 89.7 million acres. This is the largest acreage intention since 2013’s 97.3 million acres. The largest increases were in the Corn Belt and the Northern Plains with gains of 3.5 million and 1.6 million acres respectively. The amount of corn actually planted depends on how market and weather conditions evolve during the planting season. 020406080100120140160180200010203040506070809010088/89 91/92 94/95 97/98 00/01 03/04 06/07 09/10 12/13 15/16 18/19Bushels/acreMillion acresFi...





发表评论取消回复