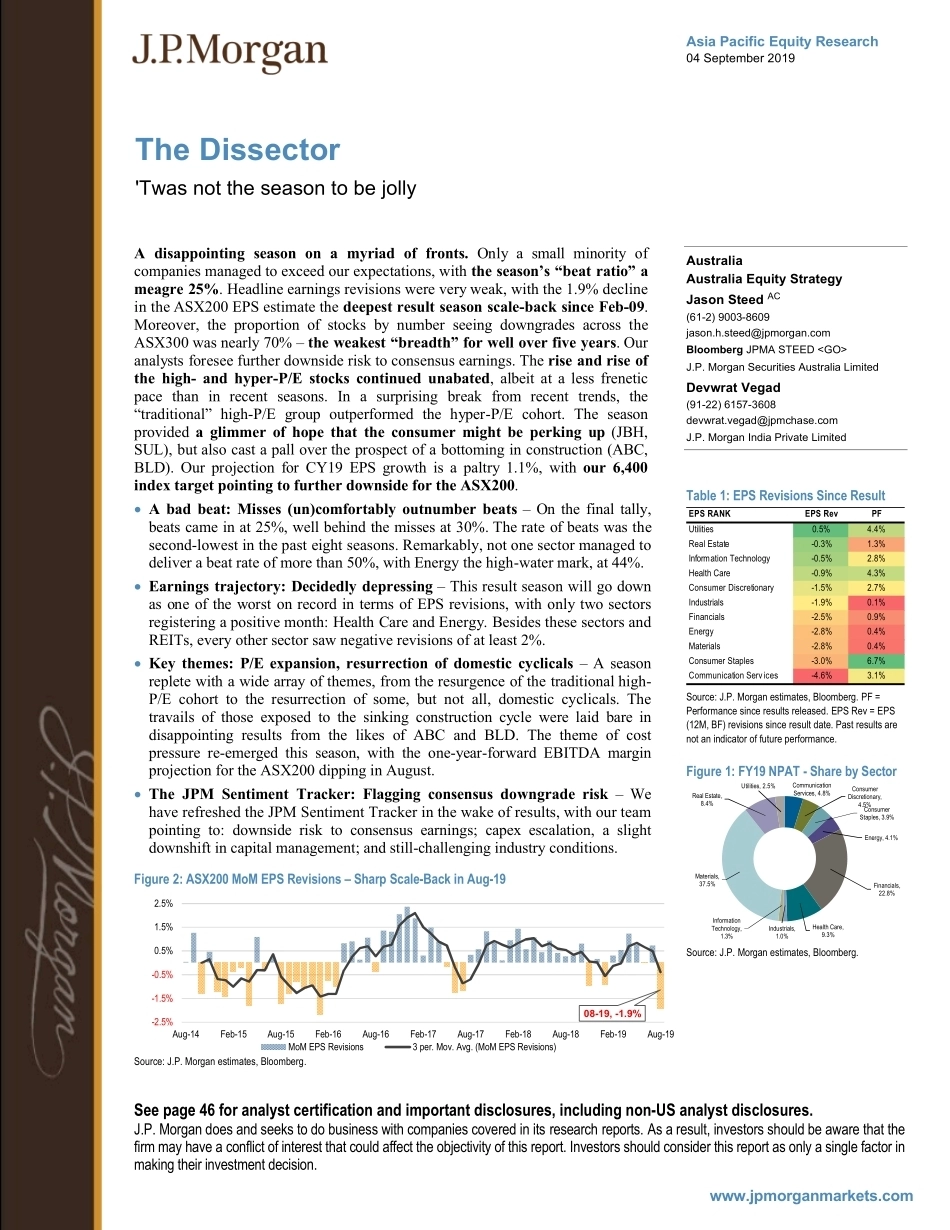
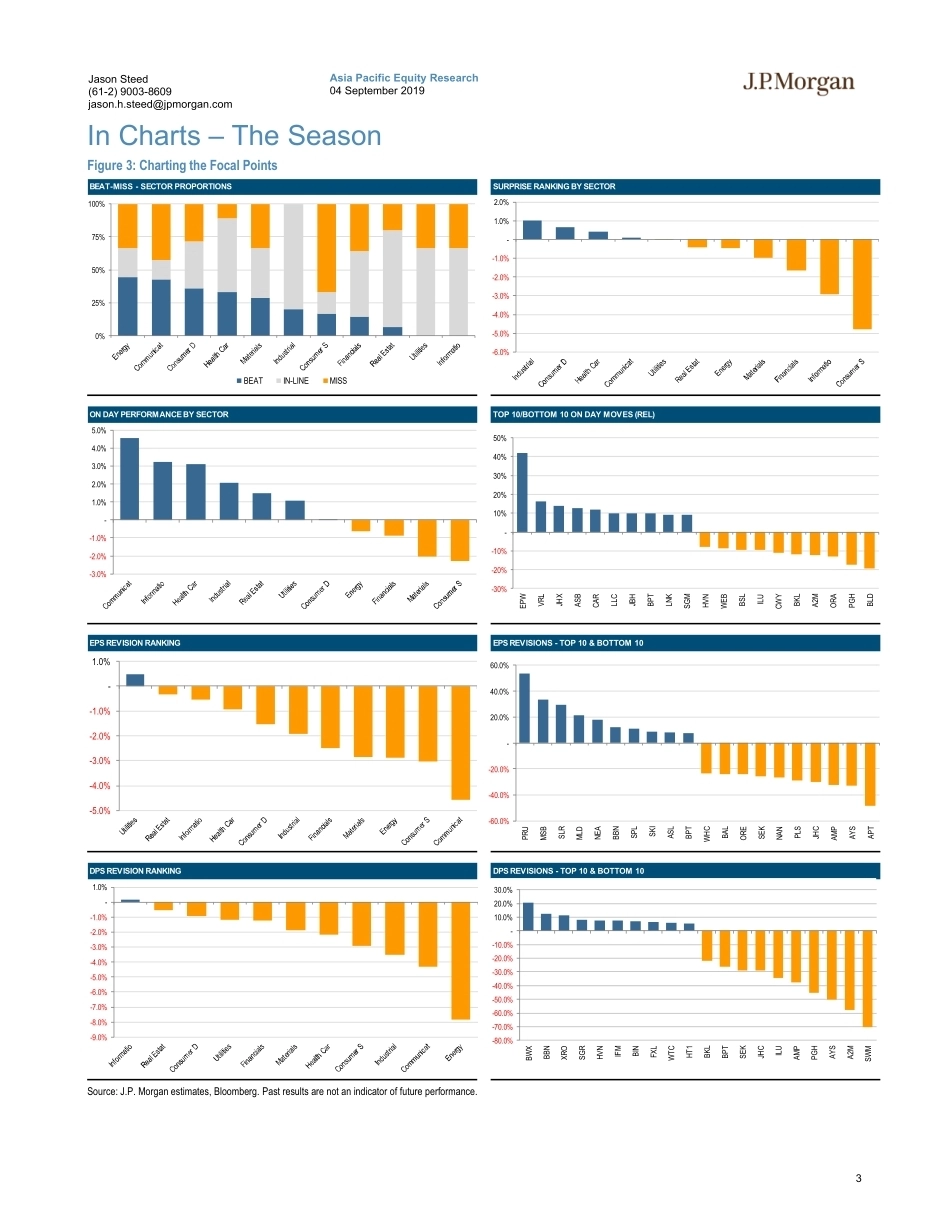
Asia Pacific Equity Research04 September 2019 The Dissector'Twas not the season to be jollyAustraliaAustralia Equity StrategyJason Steed AC(61-2) 9003-8609jason.h.steed@jpmorgan.comBloomberg JPMA STEED J.P. Morgan Securities Australia LimitedDevwrat Vegad(91-22) 6157-3608devwrat.vegad@jpmchase.comJ.P. Morgan India Private LimitedSee page 46 for analyst certification and important disclosures, including non-US analyst disclosures.J.P. Morgan does and seeks to do business with companies covered in its research reports. As a result, investors should be aware that the firm may have a conflict of interest that could affect the objectivity of this report. Investors should consider this report as only a single factor in making their investment decision.www.jpmorganmarkets.comA disappointing season on a myriad of fronts. Only a small minority of companies managed to exceed our expectations, with the season’s “beat ratio” a meagre 25%. Headline earnings revisions were very weak, with the 1.9% decline in the ASX200 EPS estimate the deepest result season scale-back since Feb-09. Moreover, the proportion of stocks by number seeing downgrades across the ASX300 was nearly 70% – the weakest “breadth” for well over five years. Our analysts foresee further downside risk to consensus earnings. The rise and rise of the high- and hyper-P/E stocks continued unabated, albeit at a less frenetic pace than in recent seasons. In a surprising break from recent trends, the “traditional” high-P/E group outperformed the hyper-P/E cohort. The season provided a glimmer of hope that the consumer might be perking up (JBH, SUL), but also cast a pall over the prospect of a bottoming in construction (ABC, BLD). Our projection for CY19 EPS growth is a paltry 1.1%, with our 6,400 index target pointing to further downside for the ASX200. A bad beat: Misses (un)comfortably outnumber beats – On the final tally, beats came in at 25%, well behind the misses at 30%. The rate of beats was the second-lowest in the past eight seasons. Remarkably, not one sector managed to deliver a beat rate of more than 50%, with Energy the high-water mark, at 44%. Earnings trajectory: Decidedly depressing – This result season will go down as one of the worst on record in terms of EPS revisions, with only two sectors registering a positive month: Health Care and Energy. Besides these sectors and REITs, every other sector saw negative revisions of at least 2%. Key themes: P/E expansion, resurrection of domestic cyclicals – A season replete with a wide array of themes, from the resurgence of the traditional high-P/E cohort to the resurrection of some, but not all, domestic cyclicals. The travails of those exposed to the sinking construction cycle were laid bare in disappointing results from the likes of ABC and BLD. The theme of cost pressure re-emerged this season, with the one-year-forward EBITDA margin projection for the ASX200 dipping in August. The JPM Sentiment Tracker: Flagging consensus downgrade risk – We have refreshed the JPM Sentiment Tracker in the wake of results, with our team pointing to: downside risk to consensus earnings; capex escalation, a slight downshift in capital management; and still-challenging industry conditions. Figure 2: ASX200 MoM EPS Revisions – Sharp Scale-Back in Aug-19Source: J.P. Morgan estimates, Bloomberg.08-19, -1.9%-2.5%-1.5%-0.5%0.5%1.5%2.5%Aug-14Feb-15Aug-15Feb-16Aug-16Feb-17Aug-17Feb-18Aug-18Feb-19Aug-19MoM EPS Revisions3 per. Mov. Avg. (MoM EPS Revisions)Table 1: EPS Revisions Since ResultSource: J.P. Morgan estimates, Bloomberg. PF =Performance since results released. EPS Rev = EPS (12M, BF) revisions since result date. Past results are not an indicator of future performance.Figure 1: FY19 NPAT - Share by SectorSource: J.P. Morgan estimates, Bloomberg.EPS RANKEPS RevPFUtilities0.5%4.4%Real Estate-0.3%1.3%Information Technology-0.5%2.8%Health Care-0.9%4.3%Consumer Discretionary-1.5%2.7%Industrials-1.9%0.1%Financials-2.5%0.9%Energy-2.8%0.4%Materials-2.8%0.4%Consumer Staples-3.0%6.7%Communication Services-4.6%3.1%Communication Services, 4.8%Consumer Discretionary, 4.5%Consumer Staples, 3.9%Energy, 4.1%Financials, 22.8%Health Care, 9.3%Industrials, 1.0%Information Technology, 1.3%Materials, 37.5%Real Estate, 8.4%Utilities, 2.5%2Asia Pacific Equity Research04 September 2019Jason Steed(61-2) 9003-8609jason.h.steed@jpmorgan.com Table of ContentsIn Charts – The Season............................................................3The Final Dissection ................................................................4JPM Bull Bear – Key Ideas ......................................................8Key Themes..............................................................................9Beats and Misses – Missing the Mark ..................................24Revisions: EPS, DPS and PT.................................................28Trends in Revenue, EBIT and NPAT.....................................31JPM Sentiment Tracker............




发表评论取消回复