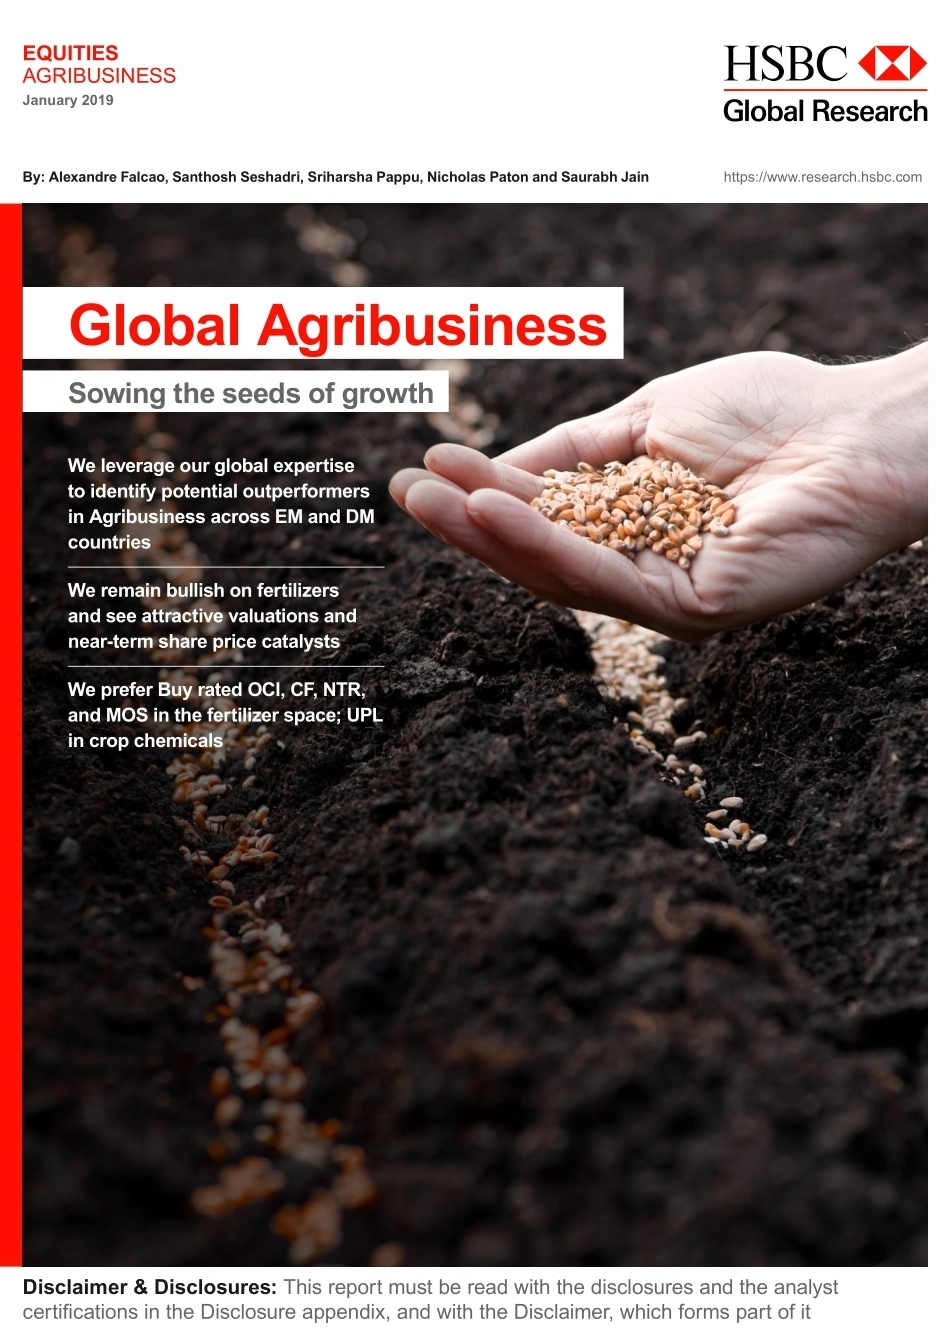
Disclaimer & Disclosures: This report must be read with the disclosures and the analyst certifications in the Disclosure appendix, and with the Disclaimer, which forms part of ithttps://www.research.hsbc.comGlobal Agribusiness Sowing the seeds of growthWe leverage our global expertise to identify potential outperformers in Agribusiness across EM and DM countriesWe remain bullish on fertilizers and see attractive valuations and near-term share price catalystsWe prefer Buy rated OCI, CF, NTR, and MOS in the fertilizer space; UPL in crop chemicals EQUITIESAGRIBUSINESSJanuary 2019By: Alexandre Falcao, Santhosh Seshadri, Sriharsha Pappu, Nicholas Paton and Saurabh Jain 1 EQUITIES ● AGRIBUSINESS January 2019 Why read this report We leverage our exposure in the US, India, Europe, China, Latin America, and Middle East to come up with a cohesive and comprehensive view of the agribusiness value chain We outline our expectation for NPK, and update our price forecasts and SD estimates We analyze the impact of NPK prices on the earnings momentum of companies We address investor questions related to acceleration in Chinese urea exports and the impact of potentially lower input costs for marginal players We analyze in detail crop fundamentals and outlook for India, the major growth market for fertilizers We highlight our preferred plays in the space (page 8) and identify key share price catalysts EQUITIES ● AGRIBUSINESS January 2019 2 Fertilizer 101 Nitrogen (N) Phosphate (P) Potash (K) Benefits to plant Essential for stem and cell structure growth, increases height Accelerated plant metabolism, optimizes usage of N & K Better root development, fills out inner cell structure, helps resist drought Recommended application Every 4-6 months, nitrogen evaporates and cannot be skipped Annual, but can be skipped for a year without significant loss of yield Annual, but can be skipped for a year without significant loss of yield Popular products and typical nutrient content per unit Urea (46%), Ammonia (82%), UAN (32%), AN (34.5%), CAN (28%), Ammonium Sulphate (21%) DAP (46%), MAP (52%), SSP (22%), TSP (48%), Phosphoric acid (74%), MGA (54%), SPA (70%) MOP (60%), Potassium sulphate (50-54%) Global Ag consumption (million nutrient tonnes) - 2017/18 107 (56%) 48 (25%) 35 (19%) Key crops Wheat, rice, corn, and fruit and vegetables (65-70% of total) Wheat, rice, corn, soybean, oilseeds, and fruit and vegetables (c75%) Rice, corn, wheat, soy, oil palm, fruit and vegetables, and fiber crops (c80% ) Industrial use (% of total) 25-30% 12% 9% Primary industrial use Plastics, resins, adhesives, and emission controls Soft drinks, food additives, and metal treatments Soaps, water softeners, deicers, drilling muds, and food products Key raw materials/process Natural gas (70-80% of total cost of ammonia) and nitric acid Phosrock (50-60% of cost), sulphur (10-15%) and ammonia (15-20%); phosrock is mined from deposits (typically shallow pit) Mined from deep rock deposits and salt lakes Industry structure Highly fragmented Fewer suppliers than N, minimal discipline with a high focus on volumes; consolidating market Historically oligopolistic; landscape changing with new suppliers coming online; top six account for 80% of share Key industry players CF Industries, Yara, OCI, Industries Qatar, SAFCO, Nutrien, Koch, TOAZ, Eurochem, and Group DF Mosaic, Maaden, Nutrien, OCP, Yuntianhua, Wengfu, and PhosAgro Nutrien, Mosaic, Uralkali, Belaruskali, ICL, K+S, SQM, Arab Potash Company Top producers (2017) China, the US, India, and Russia constitute c55% of world capacity China, Morocco, and the US account for c60% of world capacity Canada, Russia, Belarus, and China constitute 77% of world capacity Top consumers (2017) China, India, the US, and Brazil constitute 65% of consumption China, India, the US, and Brazil constitute 66% of consumption China, India, the US, and Brazil constitute 61% of consumption Top importers (2016) India, the US, and Brazil (c38% of total urea) India, Brazil, the US (c40% of DAP/MAP) Brazil, the US, China, India (c78% of total) Top exporters (2016) Russia, Qatar, China, and Saudi Arabia (c48% of urea) The US, China, and Morocco (c65% of total) Canada and FSU (c75% of total) Historical growth rate (15yr) 2.0% 2.0% 2.6% Source: Company reports, IFA, CRU, FAO, HSBC 3 EQUITIES ● AGRIBUSINESS January 2019 Executive Summary 4 2019 outlook 6 Nitrogen 9 Phosphates 14 Potash 18 Companies 25 Nutrien Ltd (NTR US) 26 Mosaic Ltd (MOS US) 27 CF Industries (CF US) 28 OCI NV (OCI NA) 29 UPL Ltd. (UPLL IN) 31 Coromandel International (CRIN IN) 32 Industries Qatar (IQCD QD) 33 Disclosure appendix 43 Disclaimer 48 Contents EQUITIES ● AGRIBUSINESS January 2019 4 What does 2019 hold for Global Agchem? We have collaborated with our Global Agribusiness team to come up with a comprehensive view on the sector and highlight our preferred plays. In 2019, we believe nitrogen prices are poised to grow higher (urea, +9%), driven...





发表评论取消回复