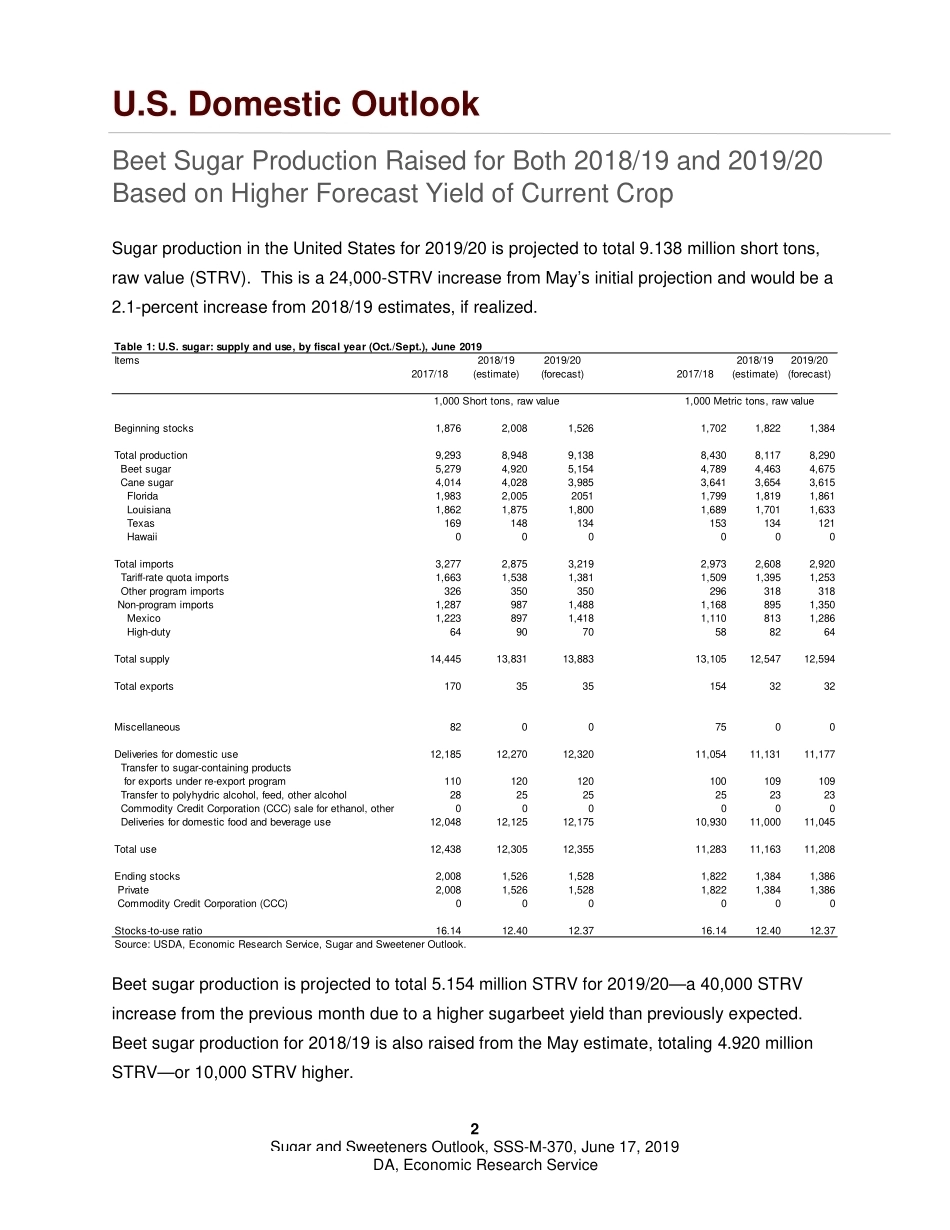
USDA, Economic Research Service Sugar and Sweeteners Outlook Michael McConnell, coordinator David Olson, contributor U.S. Sugar Production Slightly Higher for 2019/20 Based on Sugarbeet Planting Pace The June World Agricultural Supply and Demand Estimates (WASDE) raised U.S. sugar production for 2019/20, as higher beet sugar production outweighed lower cane sugar expectations. Beet sugar production is also raised for 2018/19 due to higher early-season production from higher expected yields from the sugarbeet 2019/20 crop. No changes were made to the forecast use for either 2018/19 or 2019/20. Mexico sugar production is raised for both 2018/19 and 2019/20. Coming into the final weeks of the Mexico sugarcane harvest campaign, the 2018/19 season is on pace to be well ahead of recent year’s totals. With limited growth in domestic markets and constraints on exports to the United States, shipments to the global market are expected to increase significantly from recent years to bring stock levels in line with historical averages. In the Foreign Agricultural Service’s (FAS) initial projections for global sugar markets in 2019/20, world production and consumption are expected to increase at a steady rate. Global supplies are still relatively large in 2018/19 from the record production year of 2017/18. This still weighs on the global market, with major sugar-producing and trading countries continuing to respond to these market conditions. Looking forward to 2019/20, however, global sugar markets are expected to return to more stable conditions. 1 Sugar and Sweeteners Outlook, SSS-M-370, June 17, 2019 Approved by the World Agricultural Outlook Board. Next release is July 17, 2019 SSS-M-370 | June 17, 20192 Sugar and Sweeteners Outlook, SSS-M-370, June 17, 2019 USDA, Economic Research Service U.S. Domestic Outlook Beet Sugar Production Raised for Both 2018/19 and 2019/20 Based on Higher Forecast Yield of Current Crop Sugar production in the United States for 2019/20 is projected to total 9.138 million short tons, raw value (STRV). This is a 24,000-STRV increase from May’s initial projection and would be a 2.1-percent increase from 2018/19 estimates, if realized. Beet sugar production is projected to total 5.154 million STRV for 2019/20—a 40,000 STRV increase from the previous month due to a higher sugarbeet yield than previously expected. Beet sugar production for 2018/19 is also raised from the May estimate, totaling 4.920 million STRV—or 10,000 STRV higher. Table 1: U.S. sugar: supply and use, by fiscal year (Oct./Sept.), June 2019Items2019/202019/20(forecast)(forecast)Beginning stocks 1,8762,0081,5261,7021,8221,384Total production 9,2938,9489,1388,4308,1178,290 Beet sugar5,2794,9205,1544,7894,4634,675 Cane sugar4,0144,0283,9853,6413,6543,615 Florida1,9832,00520511,7991,8191,861 Louisiana1,8621,8751,8001,6891,7011,633 Texas169148134153134121 Hawaii000000Total imports3,2772,8753,2192,9732,6082,920 Tariff-rate quota imports 1,6631,5381,3811,5091,3951,253 Other program imports326350350296318318 Non-program imports1,2879871,4881,1688951,350 Mexico 1,2238971,4181,1108131,286 High-duty649070588264Total supply14,44513,83113,88313,10512,54712,594Total exports 17035351543232Miscellaneous82007500Deliveries for domestic use12,18512,27012,32011,05411,13111,177 Transfer to sugar-containing products for exports under re-export program110120120100109109 Transfer to polyhydric alcohol, feed, other alcohol282525252323 Commodity Credit Corporation (CCC) sale for ethanol, other000000 Deliveries for domestic food and beverage use 12,04812,12512,17510,93011,00011,045Total use12,43812,30512,35511,28311,16311,208Ending stocks 2,0081,5261,5281,8221,3841,386 Private2,0081,5261,5281,8221,3841,386 Commodity Credit Corporation (CCC)000000Stocks-to-use ratio16.1412.4012.3716.1412.4012.37Source: USDA, Economic Research Service, Sugar and Sweetener Outlook.2018/19 (estimate)2017/181,000 Short tons, raw value1,000 Metric tons, raw value2017/182018/19 (estimate)Table 2: Beet sugar production projection calculation, 2018/19 and 2019/202014/152015/162016/172017/182018/192018/192019/202019/20MayJuneMayJuneSugarbeet production (1,000 short tons) 1/31,28535,37136,88135,32533,14533,14533,55633,916Sugarbeet shrink 2/5.4%6.5%8.3%7.3%5.0%5.0%6.5%6.5%Sugarbeet sliced (1,000 short tons)29,59533,06633,83432,74231,48831,48831,37531,712Sugar extraction rate from slice14.6%14.6%13.7%15.2%14.8%14.8%14.6%14.6%Sugar from beets slice (1,000 STRV)4,3254,8204,6434,9704,6634,6634,5754,624Sugar from molasses (1,000 STRV) 2/341380352368368368368368Crop-year sugar production (1,000 STRV) 3/4,6675,2014,9955,3385,0315,0314,9434,992August-September sugar production (1,000 STRV)461688606715655655502511August-September sugar production forecast (1,000 STRV)688606715655502511633633Sugar from imported beets (1,000 STRV) 4/--------33334040Fiscal year sugar production (1,000 STRV)4,8935,1195,1035,2794,9104,9205,1145,154Notes: 1/ USDA, National Agricultural Statistics Service. 2/ Pro...





发表评论取消回复