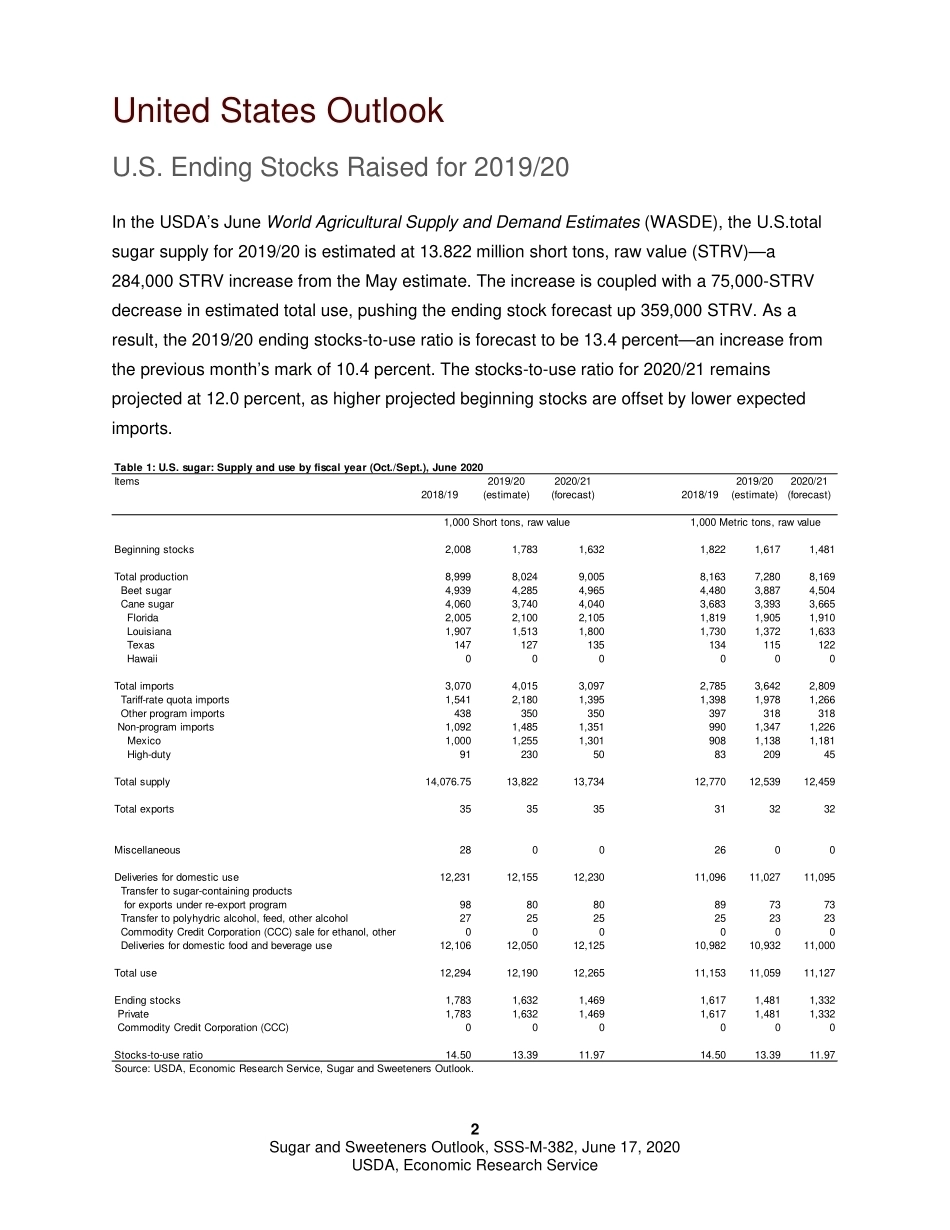
Approved by USDA’s World Agricultural Outlook Board Sugar and Sweeteners Outlook Michael McConnell, coordinator Jennifer K. Bond, contributor U.S. Sugar Market Ending Stocks for 2019/20 Raised on Higher Imports, Lower Use The U.S. sugar market in 2019/20 is estimated to have a stocks-to-use ratio of 13.4 percent, compared with 10.4 percent the previous month. Domestic deliveries are reduced 75,000 short tons, raw value (STRV) based on lower deliveries reported in April, as consumers shifted heavily toward at-home food consumption. Imports are raised 284,000 STRV from the previous month due to higher shipments from Mexico and more high-tier imports expected. Projected ending stocks for 2020/21 remain unchanged, as higher beginning stocks are offset by lower imports from Mexico. Mexico sugar production is raised 105,000 metric tons, actual value (MT) to 5.230 million MT, as the harvest is scheduled to conclude by the end of June. Domestic deliveries are lowered 70,000 MT. As a result, Mexico is forecast to have additional supplies for export to the United States for 2019/20. The global sugar market is projected to see production and consumption rebound in 2020/21 on higher field and factory yields, after poor weather conditions in several major sugar-producing countries resulted in a production deficit for 2019/20. The global sugar market will be influenced by weather, public health and domestic health policies, and macroeconomic factors such as oil prices and exchange rates, however, resulting in expected market volatility. U.S. honey production increased in 2019, but the national average price fell. Imports continue to account for most of the domestic supply, as pollinator migratory patterns follow the seasonal movement of forage areas and economic drivers.Economic Research Service | Situation and Outlook Report Next release is July 16, 2020 SSS-M-382 | June 17, 2020 In this report: U.S. Sugar Outlook Mexico Sugar Outlook Global Sugar Markets U.S. Honey Market 2 Sugar and Sweeteners Outlook, SSS-M-382, June 17, 2020 USDA, Economic Research Service United States Outlook U.S. Ending Stocks Raised for 2019/20 In the USDA’s June World Agricultural Supply and Demand Estimates (WASDE), the U.S.total sugar supply for 2019/20 is estimated at 13.822 million short tons, raw value (STRV)—a 284,000 STRV increase from the May estimate. The increase is coupled with a 75,000-STRV decrease in estimated total use, pushing the ending stock forecast up 359,000 STRV. As a result, the 2019/20 ending stocks-to-use ratio is forecast to be 13.4 percent—an increase from the previous month’s mark of 10.4 percent. The stocks-to-use ratio for 2020/21 remains projected at 12.0 percent, as higher projected beginning stocks are offset by lower expected imports. Table 1: U.S. sugar: Supply and use by fiscal year (Oct./Sept.), June 2020Items2019/202020/212019/202020/21(estimate)(forecast)(estimate)(forecast)Beginning stocks 2,0081,7831,6321,8221,6171,481Total production 8,9998,0249,0058,1637,2808,169 Beet sugar4,9394,2854,9654,4803,8874,504 Cane sugar4,0603,7404,0403,6833,3933,665 Florida2,0052,1002,1051,8191,9051,910 Louisiana1,9071,5131,8001,7301,3721,633 Texas147127135134115122 Hawaii000000 Total imports3,0704,0153,0972,7853,6422,809 Tariff-rate quota imports 1,5412,1801,3951,3981,9781,266 Other program imports438350350397318318 Non-program imports1,0921,4851,3519901,3471,226 Mexico 1,0001,2551,3019081,1381,181 High-duty91230508320945Total supply14,076.7513,82213,73412,77012,53912,459Total exports 353535313232Miscellaneous28002600Deliveries for domestic use12,23112,15512,23011,09611,02711,095 Transfer to sugar-containing products for exports under re-export program988080897373 Transfer to polyhydric alcohol, feed, other alcohol272525252323 Commodity Credit Corporation (CCC) sale for ethanol, other000000 Deliveries for domestic food and beverage use 12,10612,05012,12510,98210,93211,000Total use12,29412,19012,26511,15311,05911,127Ending stocks 1,7831,6321,4691,6171,4811,332 Private1,7831,6321,4691,6171,4811,332 Commodity Credit Corporation (CCC)000000Stocks-to-use ratio14.5013.3911.9714.5013.3911.97Source: USDA, Economic Research Service, Sugar and Sweeteners Outlook.2018/191,000 Short tons, raw value1,000 Metric tons, raw value2018/19rMsOoMuMuM6M9RbRnPrRpNoOiNnNqOeRrQvNbRoPnQNZpMyQwMoOrP3 Sugar and Sweeteners Outlook, SSS-M-382, June 17, 2020 USDA, Economic Research Service U.S. Sugar Deliveries for 2019/20 Reduced Total U.S. sugar use is estimated at 12.190 million STRV for 2019/20. The decrease from the May estimate is due to lower domestic deliveries for food and beverage use, which is reduced 75,000-STRV to 12.050 million STRV. The social and economic impacts of the COVID-19 pandemic have been a factor in the market since mid-March when many U.S. States and municipalities began issuing public policies that altered consumers’ behavior. There are several key data points observed that resulted in the lowering of estimated deliveries, an...





发表评论取消回复