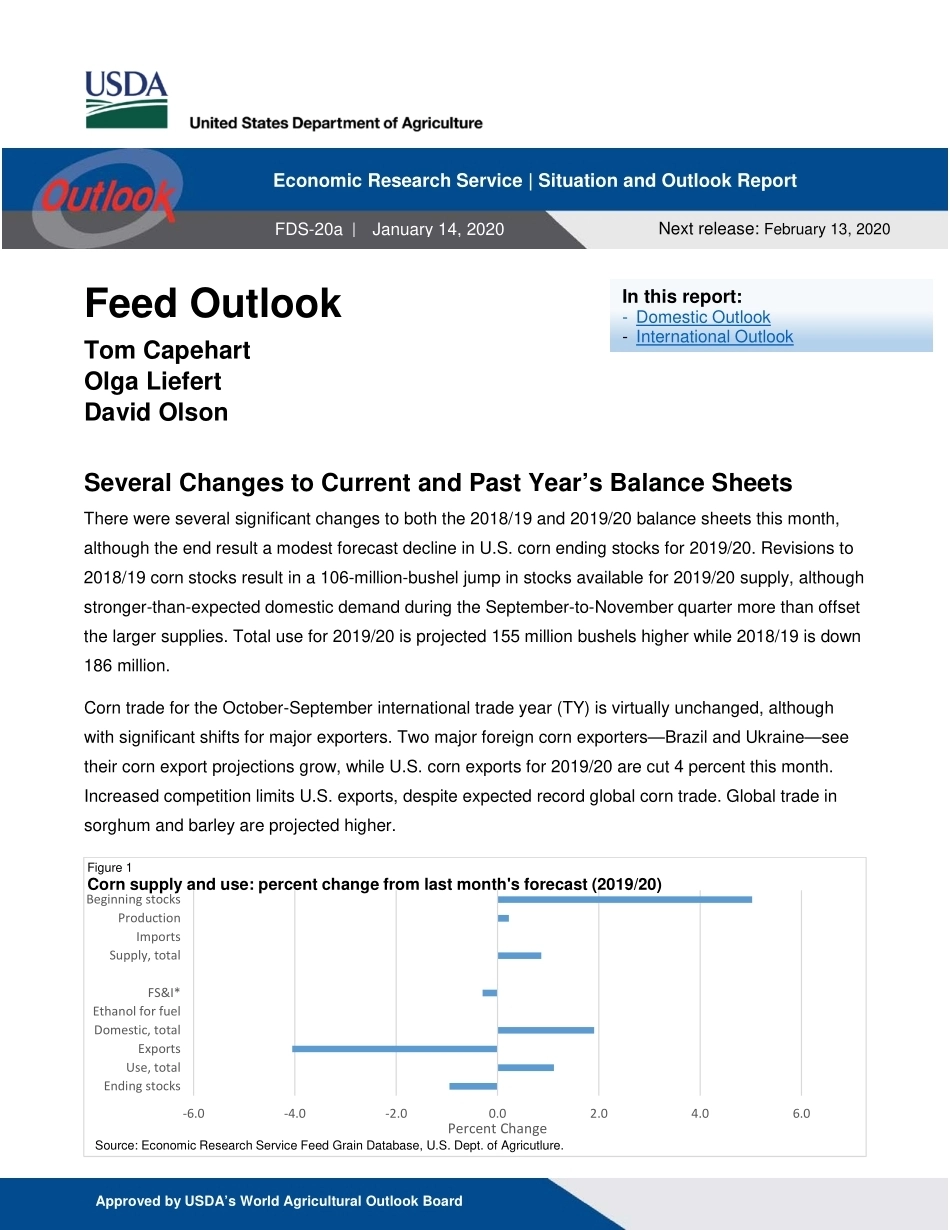
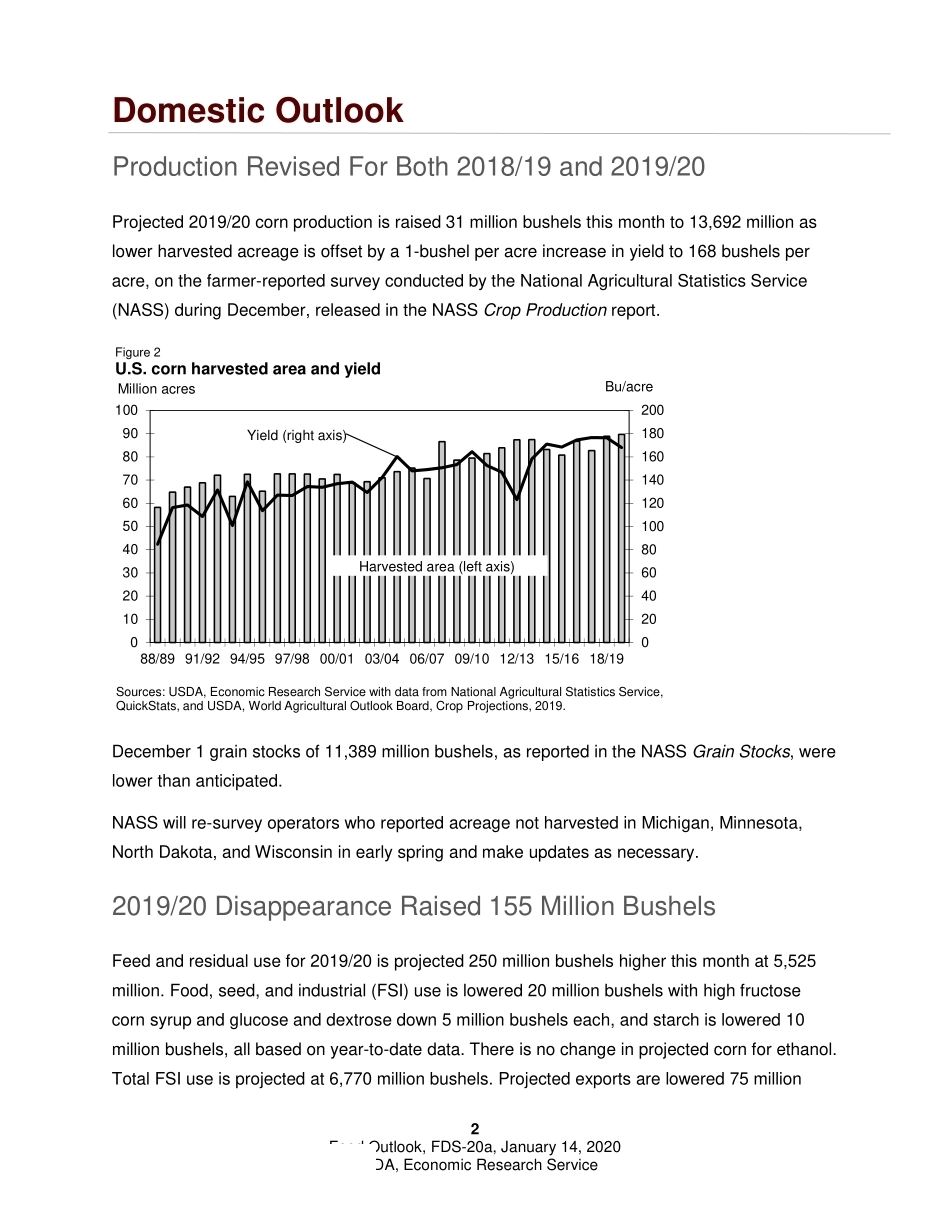
Approved by USDA’s World Agricultural Outlook Board Feed Outlook Tom Capehart Olga Liefert David Olson Several Changes to Current and Past Year’s Balance Sheets There were several significant changes to both the 2018/19 and 2019/20 balance sheets this month, although the end result a modest forecast decline in U.S. corn ending stocks for 2019/20. Revisions to 2018/19 corn stocks result in a 106-million-bushel jump in stocks available for 2019/20 supply, although stronger-than-expected domestic demand during the September-to-November quarter more than offset the larger supplies. Total use for 2019/20 is projected 155 million bushels higher while 2018/19 is down 186 million. Corn trade for the October-September international trade year (TY) is virtually unchanged, although with significant shifts for major exporters. Two major foreign corn exporters—Brazil and Ukraine—see their corn export projections grow, while U.S. corn exports for 2019/20 are cut 4 percent this month. Increased competition limits U.S. exports, despite expected record global corn trade. Global trade in sorghum and barley are projected higher. -6.0-4.0-2.00.02.04.06.0Ending stocksUse, totalExportsDomestic, totalEthanol for fuelFS&I*Supply, totalImportsProductionBeginning stocksPercent ChangeSource: Economic Research Service Feed Grain Database, U.S. Dept. of Agricutlure.Figure 1Corn supply and use: percent change from last month's forecast (2019/20)Economic Research Service | Situation and Outlook Report Next release: February 13, 2020 FDS-20a | January 14, 2020In this report: - Domestic Outlook- International Outlook 2 Feed Outlook, FDS-20a, January 14, 2020 USDA, Economic Research Service Domestic Outlook Production Revised For Both 2018/19 and 2019/20 Projected 2019/20 corn production is raised 31 million bushels this month to 13,692 million as lower harvested acreage is offset by a 1-bushel per acre increase in yield to 168 bushels per acre, on the farmer-reported survey conducted by the National Agricultural Statistics Service (NASS) during December, released in the NASS Crop Production report. December 1 grain stocks of 11,389 million bushels, as reported in the NASS Grain Stocks, were lower than anticipated. NASS will re-survey operators who reported acreage not harvested in Michigan, Minnesota, North Dakota, and Wisconsin in early spring and make updates as necessary. 2019/20 Disappearance Raised 155 Million Bushels Feed and residual use for 2019/20 is projected 250 million bushels higher this month at 5,525 million. Food, seed, and industrial (FSI) use is lowered 20 million bushels with high fructose corn syrup and glucose and dextrose down 5 million bushels each, and starch is lowered 10 million bushels, all based on year-to-date data. There is no change in projected corn for ethanol. Total FSI use is projected at 6,770 million bushels. Projected exports are lowered 75 million 020406080100120140160180200010203040506070809010088/89 91/92 94/95 97/98 00/01 03/04 06/07 09/10 12/13 15/16 18/19Bu/acreMillion acresFigure 2U.S. corn harvested area and yieldSources: USDA, Economic Research Service with data from National Agricultural Statistics Service, QuickStats, and USDA, World Agricultural Outlook Board, Crop Projections, 2019.Harvested area (left axis)Yield (right axis)3 Feed Outlook, FDS-20a, January 14, 2020 USDA, Economic Research Service bushels to 1,775 million due to the slow pace of sales and shipments, the lowest of outstanding sales in early January since 2012/13. With total use projected at 14,070 million bushels, ending stocks are pegged at 1,892 million and stocks-to-use are projected slightly tighter at 13.4, compared with 13.7 last month. For 2018/19, NASS revised harvested area made for an 80-million bushel reduction in production to 14,340 million and a reduction in supply of 80 million bushels to 16,509 million. In addition, September 1, 2019 stocks are revised upward by 106 million bushels to 2,221 million; thus, implied feed and residual disappearance is down 186 million bushels relative to last month. First quarter 2019/20 (September-November) feed and residual is a record high at 2,640 million bushels. Grain-Consuming Animal Units Grain-consuming animal units (GCAU) for 2019/20 are projected at 102.84 million units, up 0.24 million from last month. Estimated January 1 inventories fell this month for dairy and beef cattle, broilers, and layers, and also declined for beef cattle and turkeys. However, estimated January 1 inventories rose for layers, broilers, and hogs. GCAUs for 2018/19 are estimated at 100.73 million. 02468101214161888/8991/9294/9597/9800/0103/0406/0709/1012/1315/1618/19Feed and residualExportsOther food, seed, and industrial usesEthanolEnding stocksNote: Marketing year 2018/19 and 2019/20 are projected.Source: USDA, World Agricultural Outlook Board, WASDE. Figure 3 U.S. corn utilizationBillion bu4 Feed Outlook, FDS-20a, January 14, 2020 USDA, Economic Research Service Feed and Residual Use: Four F...





发表评论取消回复