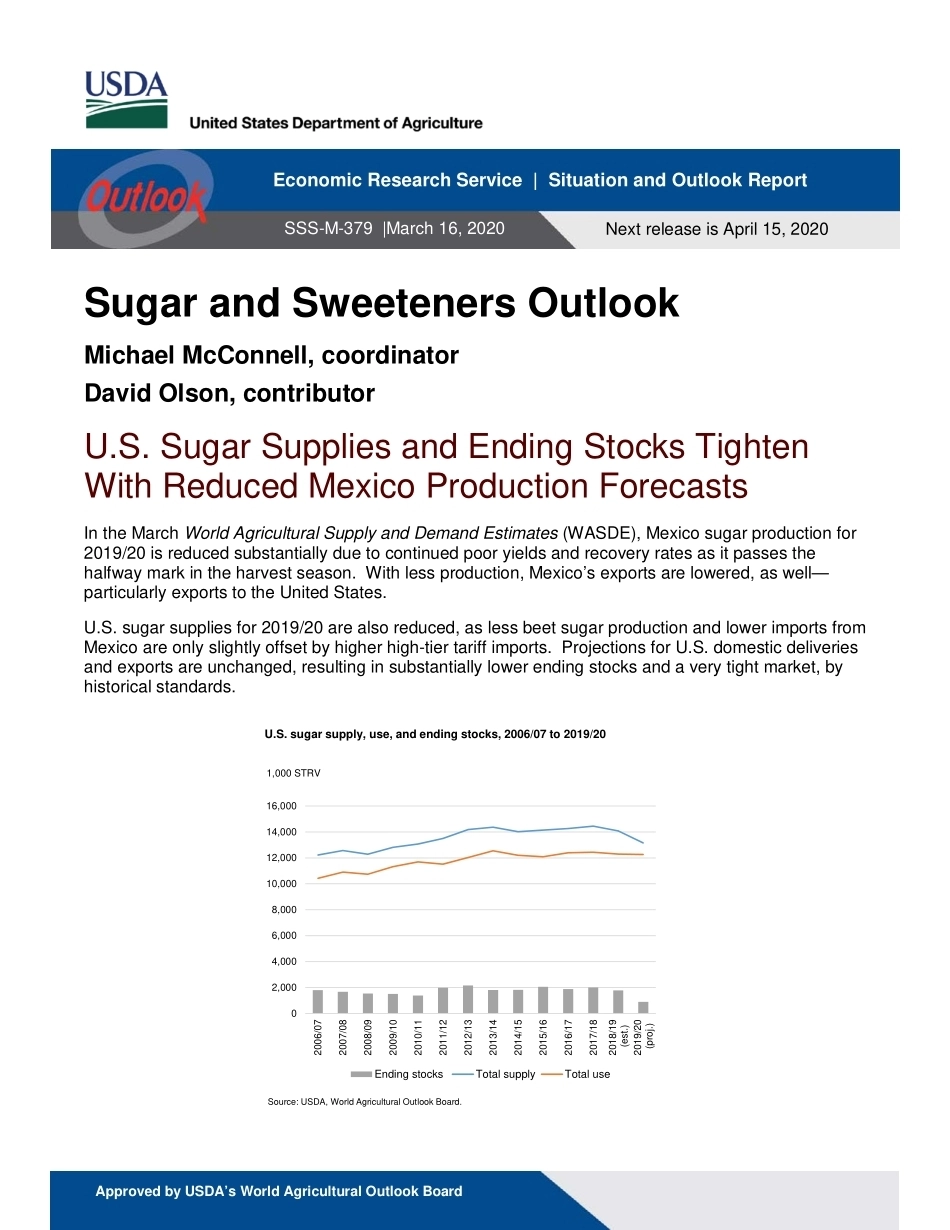
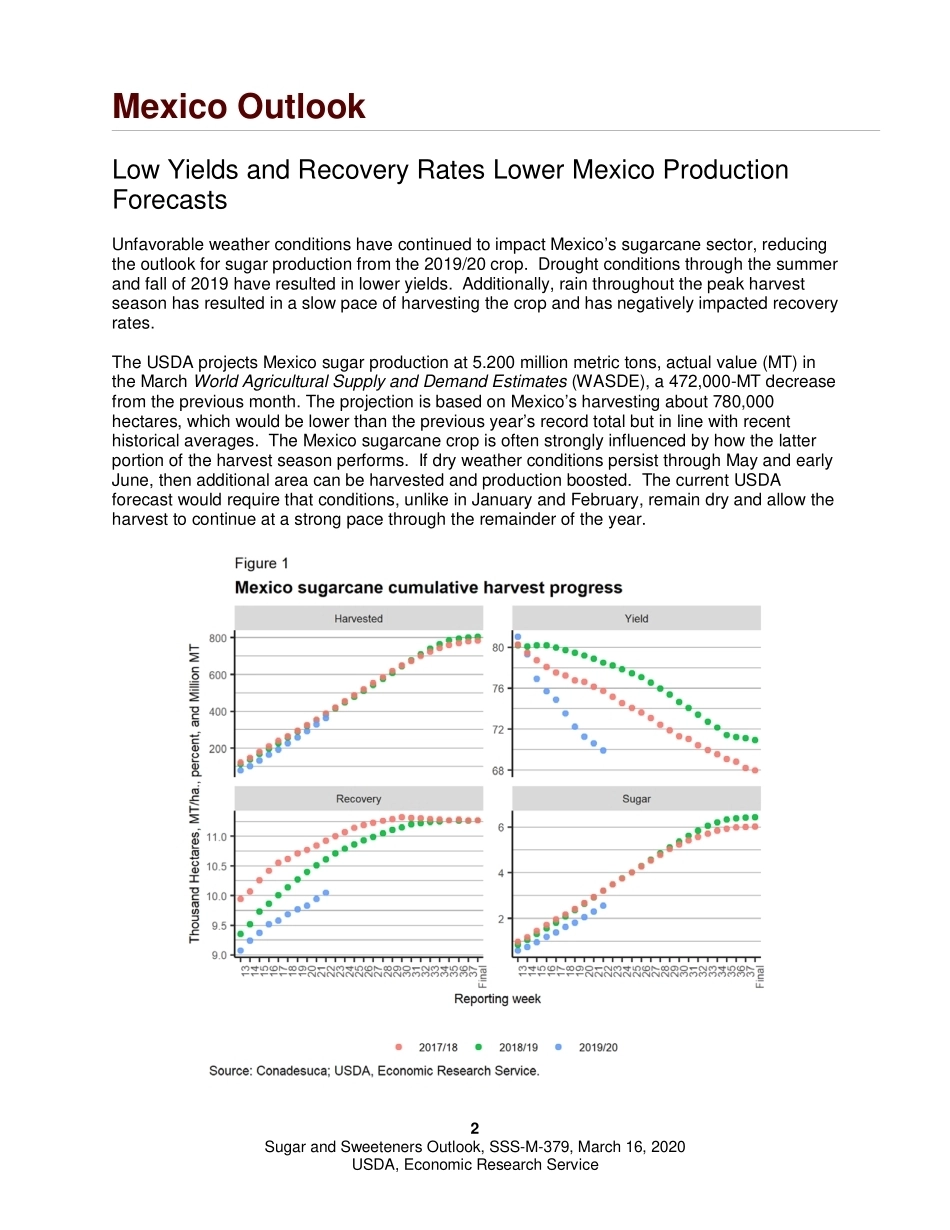
Approved by USDA’s World Agricultural Outlook Board Sugar and Sweeteners Outlook Michael McConnell, coordinator David Olson, contributor U.S. Sugar Supplies and Ending Stocks Tighten With Reduced Mexico Production Forecasts In the March World Agricultural Supply and Demand Estimates (WASDE), Mexico sugar production for 2019/20 is reduced substantially due to continued poor yields and recovery rates as it passes the halfway mark in the harvest season. With less production, Mexico’s exports are lowered, as well—particularly exports to the United States. U.S. sugar supplies for 2019/20 are also reduced, as less beet sugar production and lower imports from Mexico are only slightly offset by higher high-tier tariff imports. Projections for U.S. domestic deliveries and exports are unchanged, resulting in substantially lower ending stocks and a very tight market, by historical standards. 02,0004,0006,0008,00010,00012,00014,00016,0002006/072007/082008/092009/102010/112011/122012/132013/142014/152015/162016/172017/182018/19 (est.)2019/20 (proj.)1,000 STRVU.S. sugar supply, use, and ending stocks, 2006/07 to 2019/20Ending stocksTotal supplyTotal useSource: USDA, World Agricultural Outlook Board.Economic Research Service | Situation and Outlook Report Next release is April 15, 2020 SSS-M-379 |March 16, 2020 2 Sugar and Sweeteners Outlook, SSS-M-379, March 16, 2020 USDA, Economic Research Service Mexico Outlook Low Yields and Recovery Rates Lower Mexico Production Forecasts Unfavorable weather conditions have continued to impact Mexico’s sugarcane sector, reducing the outlook for sugar production from the 2019/20 crop. Drought conditions through the summer and fall of 2019 have resulted in lower yields. Additionally, rain throughout the peak harvest season has resulted in a slow pace of harvesting the crop and has negatively impacted recovery rates. The USDA projects Mexico sugar production at 5.200 million metric tons, actual value (MT) in the March World Agricultural Supply and Demand Estimates (WASDE), a 472,000-MT decrease from the previous month. The projection is based on Mexico’s harvesting about 780,000 hectares, which would be lower than the previous year’s record total but in line with recent historical averages. The Mexico sugarcane crop is often strongly influenced by how the latter portion of the harvest season performs. If dry weather conditions persist through May and early June, then additional area can be harvested and production boosted. The current USDA forecast would require that conditions, unlike in January and February, remain dry and allow the harvest to continue at a strong pace through the remainder of the year. sPmQtRxPvN6M8Q6MtRnNnPpPiNmMsRlOqRpQbRnMqPMYmMmNNZnMzR3 Sugar and Sweeteners Outlook, SSS-M-379, March 16, 2020 USDA, Economic Research Service Mexico’s sugarcane yields and mill recovery rates have remained much lower than historical levels. Through the end of February, the cumulative yield of the current crop is nearly 11-percent lower than the previous year, and the lowest yield on record going back to at least 2008/09. Recovery rates are at the lowest level since 1991/92, down 5 percent compared with the previous year’s crop. Typically, by this point in the harvest season, these parameters can be accurate predictors for the crop’s overall performance. The low yield and recovery rate figures can be mostly attributed to drought conditions during the growing phase of this year’s crop and are unlikely to substantially improve, even with favorable conditions for the remainder of the harvest season. Table 1: Mexico sugar supply and use, 2017/18 - 2018/19 and projected 2019/20, March 2020Items2017/182018/19 (estimate)2019/20 (forecast)Beginning stocks1,0021,3951,169Production6,0106,4265,200Imports2208589 Imports for consumption1322224 Imports for sugar-containing product exports, IMMEX 1/, other886365Total supply7,2327,9056,458Disappearance Human consumption4,2284,0924,057 For sugar-containing product exports (IMMEX)482460435 Other deliveries and end-of-year statistical adjustment29-200Total4,7394,5324,492Exports1,0992,2041,030 Exports to the United States & Puerto Rico1,047856997 Exports to other countries521,34834Total use5,8386,7375,522Ending stocks1,3951,169936Beginning stocks1,0621,4781,239Production6,3706,8115,512Imports2349094 Imports for consumption1402325 Imports for sugar-containing product exports (IMMEX) 936769Total supply7,6668,3806,845Disappearance Human consumption4,4824,3374,300 For sugar-containing product exports (IMMEX)510488461 Other deliveries and end-of-year statistical adjustment31-210Total5,0234,8044,761Exports1,1652,3371,092 Exports to the United States & Puerto Rico1,1109081,057 Exports to other countries551,42936Total use6,1887,1415,853Ending stocks1,4781,239992Stocks-to-human consumption (percent)33.028.623.1Stocks-to-use (percent)23.917.316.9High-fructose corn syrup (HFCS) consumption (dry weight)1,5931,5281,5201/ IMMEX = Industria Manufacturera, Maquiladora y...





发表评论取消回复