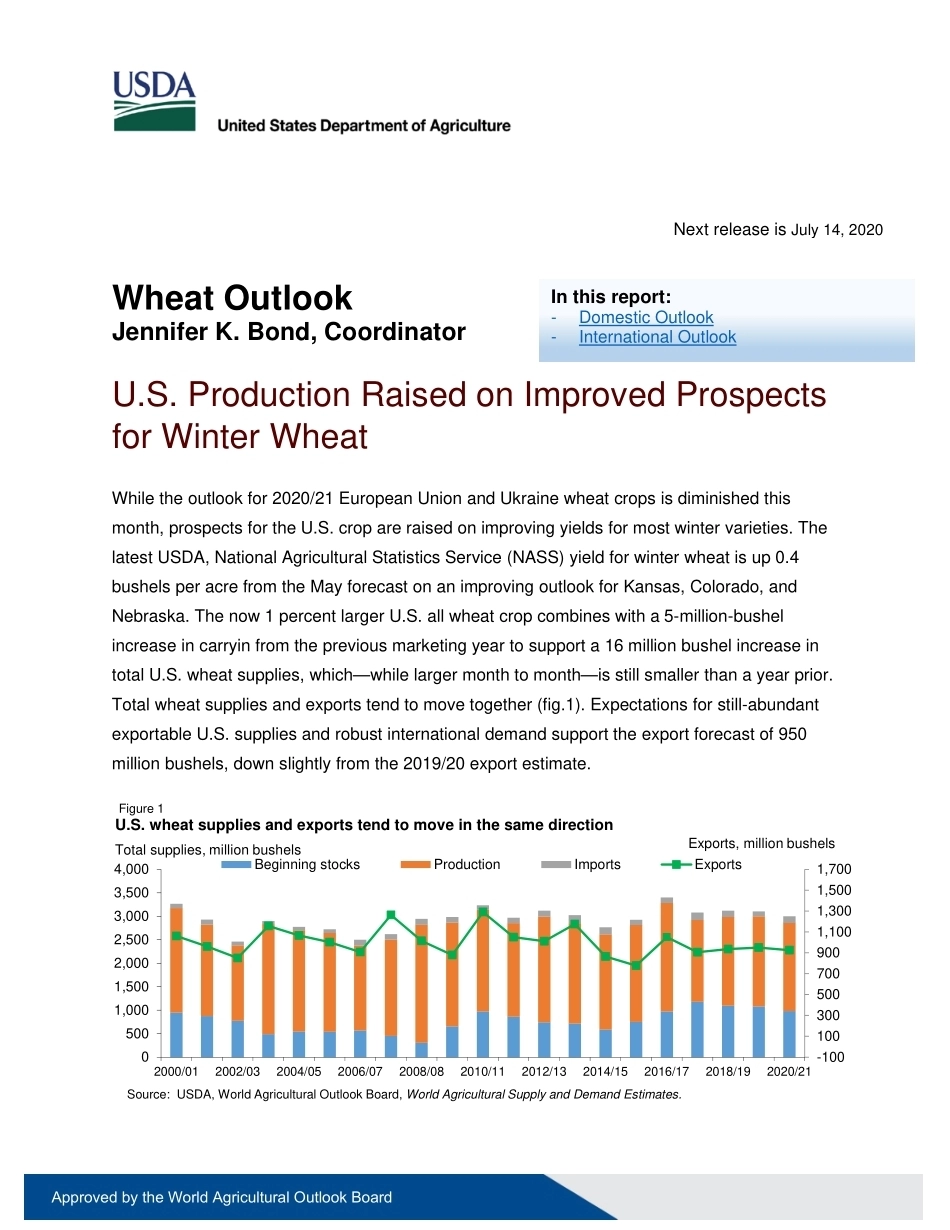
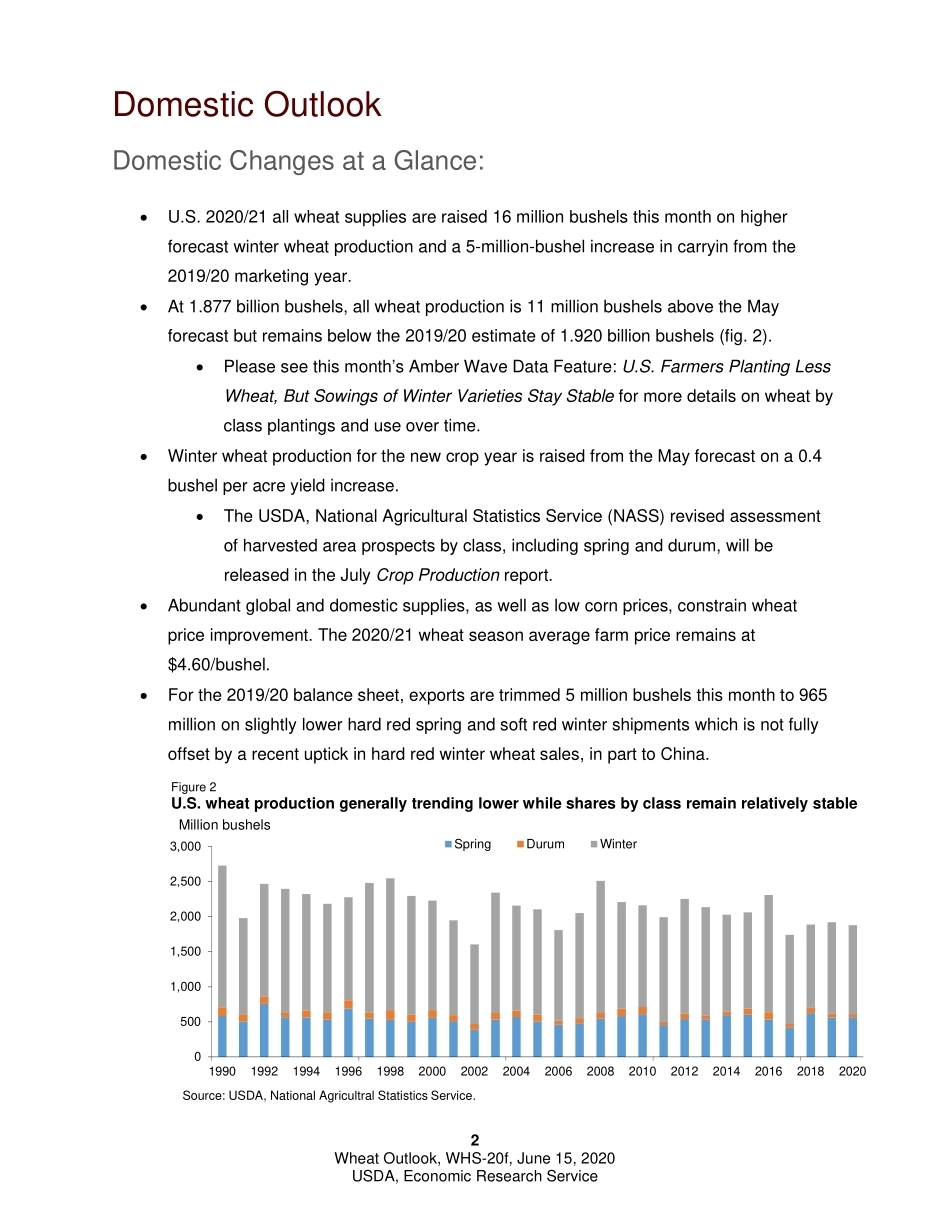
Wheat Outlook Wheat Outlook Jennifer K. Bond, Coordinator U.S. Production Raised on Improved Prospects for Winter Wheat While the outlook for 2020/21 European Union and Ukraine wheat crops is diminished this month, prospects for the U.S. crop are raised on improving yields for most winter varieties. The latest USDA, National Agricultural Statistics Service (NASS) yield for winter wheat is up 0.4 bushels per acre from the May forecast on an improving outlook for Kansas, Colorado, and Nebraska. The now 1 percent larger U.S. all wheat crop combines with a 5-million-bushel increase in carryin from the previous marketing year to support a 16 million bushel increase in total U.S. wheat supplies, which—while larger month to month—is still smaller than a year prior. Total wheat supplies and exports tend to move together (fig.1). Expectations for still-abundant exportable U.S. supplies and robust international demand support the export forecast of 950 million bushels, down slightly from the 2019/20 export estimate. -1001003005007009001,1001,3001,5001,70005001,0001,5002,0002,5003,0003,5004,0002000/012002/032004/052006/072008/082010/112012/132014/152016/172018/192020/21Beginning stocksProductionImportsExportsSource: USDA, World Agricultural Outlook Board, World Agricultural Supply and Demand Estimates. Figure 1U.S. wheat supplies and exports tend to move in the same directionTotal supplies, million bushelsExports, million bushelsNext release is July 14, 2020 WHS-20f | June 15, 2020In this report: -Domestic Outlook-International OutlookApproved by the World Agricultural Outlook BoardEconomic Research Service | Situation and Outlook Report 2 Wheat Outlook, WHS-20f, June 15, 2020 USDA, Economic Research Service Domestic Outlook Domestic Changes at a Glance: •U.S. 2020/21 all wheat supplies are raised 16 million bushels this month on higherforecast winter wheat production and a 5-million-bushel increase in carryin from the2019/20 marketing year.•At 1.877 billion bushels, all wheat production is 11 million bushels above the Mayforecast but remains below the 2019/20 estimate of 1.920 billion bushels (fig. 2).•Please see this month’s Amber Wave Data Feature: U.S. Farmers Planting LessWheat, But Sowings of Winter Varieties Stay Stable for more details on wheat byclass plantings and use over time.•Winter wheat production for the new crop year is raised from the May forecast on a 0.4bushel per acre yield increase.•The USDA, National Agricultural Statistics Service (NASS) revised assessmentof harvested area prospects by class, including spring and durum, will bereleased in the July Crop Production report.•Abundant global and domestic supplies, as well as low corn prices, constrain wheatprice improvement. The 2020/21 wheat season average farm price remains at$4.60/bushel.•For the 2019/20 balance sheet, exports are trimmed 5 million bushels this month to 965million on slightly lower hard red spring and soft red winter shipments which is not fullyoffset by a recent uptick in hard red winter wheat sales, in part to China.05001,0001,5002,0002,5003,0001990199219941996199820002002200420062008201020122014201620182020SpringDurumWinterSource: USDA, National Agricultral Statistics Service.Figure 2U.S. wheat production generally trending lower while shares by class remain relatively stableMillion bushelstOmQtRuMzR6M8QbRsQrRtRmMiNrRsMlOnMpQ7NnMqOxNsRqPMYqMsO3 Wheat Outlook, WHS-20f, June 15, 2020 USDA, Economic Research Service Table 1 - U.S. wheat supply and utilization at a glance 2019/20 Balance sheet item 2019/20 June 2020/21 May 2020/21 June 2020/21 Change from previous month Comments Supply, total May-June Marketing Year (MY) Beginning stocks 1,079.8 977.9 982.9 5.0 On reduced exports for 2019/20, associated carryout is raised 5 million bushels leading to a similar increase in beginning stocks for the 2020/21 marketing year. Production 1,920.1 1,866.0 1,877.0 11.0 The latest NASS crop production report raised the hard red winter and white winter production forecasts by one percent from the May forecast. These gains are only partially offset by a reduction for soft red winter wheat production, now forecast at 297 million bushels. Imports 105.0 140.0 140.0 0.0 Supply, total 3,104.9 2,983.9 2,999.9 16.0 Supplies are increased by the sum of additional carryin and production for the 2020/21 marketing year. While higher than the May forecast, all-wheat supplies are still expected to be lower (down 3 percent) from 2019/20 levels. Demand Food 962.0 964.0 964.0 0.0 Seed 60.0 61.0 61.0 0.0 Feed and residual 135.0 100.0 100.0 0.0 Domestic, total 1,157.0 1,125.0 1,125.0 0.0 Exports 965.0 950.0 950.0 0.0 Use, total 2,122.0 2,075.0 2,075.0 0.0 Ending stocks 982.9 908.9 924.9 16.0 With no changes to 2020/21 utilization this month, ending stocks are increased by the full amount of the increase in supplies. At 44.6 percent, the stocks-to-use ratio is modestly increased from the May figure and remains below last year's 46.3 percent. Season Average Farm ...





发表评论取消回复