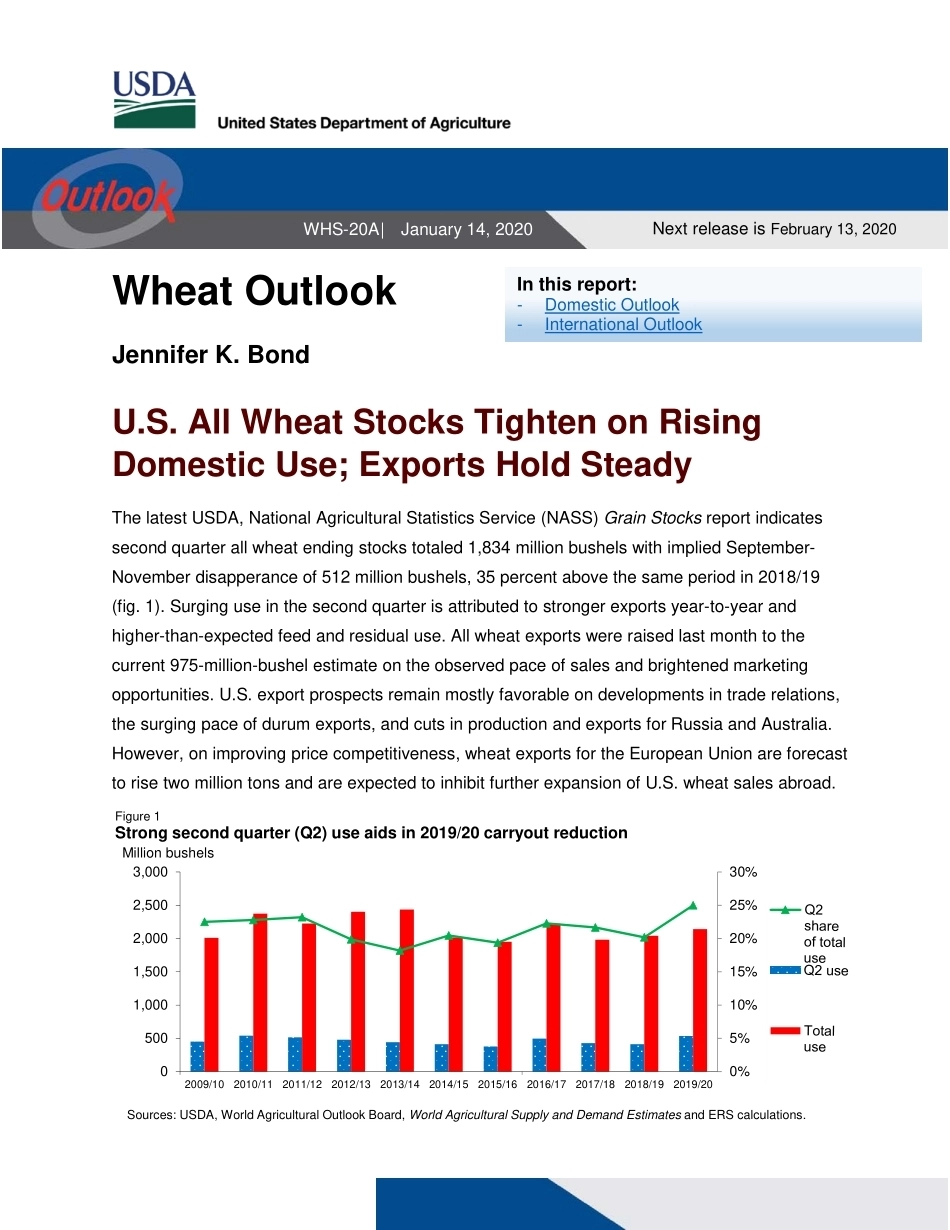
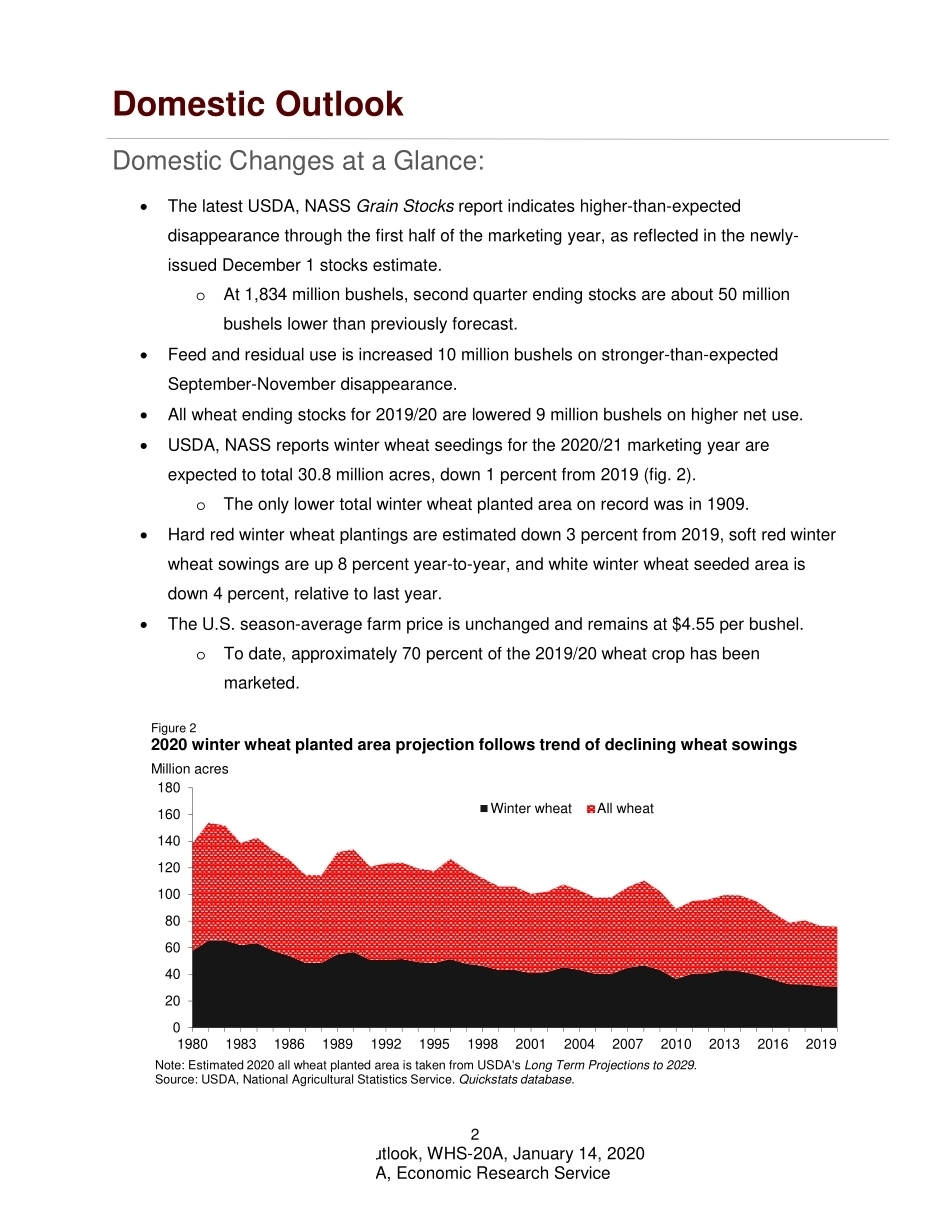
Wheat Outlook Wheat Outlook Jennifer K. Bond U.S. All Wheat Stocks Tighten on Rising Domestic Use; Exports Hold Steady The latest USDA, National Agricultural Statistics Service (NASS) Grain Stocks report indicates second quarter all wheat ending stocks totaled 1,834 million bushels with implied September-November disapperance of 512 million bushels, 35 percent above the same period in 2018/19 (fig. 1). Surging use in the second quarter is attributed to stronger exports year-to-year and higher-than-expected feed and residual use. All wheat exports were raised last month to the current 975-million-bushel estimate on the observed pace of sales and brightened marketing opportunities. U.S. export prospects remain mostly favorable on developments in trade relations, the surging pace of durum exports, and cuts in production and exports for Russia and Australia. However, on improving price competitiveness, wheat exports for the European Union are forecast to rise two million tons and are expected to inhibit further expansion of U.S. wheat sales abroad. 0%5%10%15%20%25%30%05001,0001,5002,0002,5003,0002009/102010/112011/122012/132013/142014/152015/162016/172017/182018/192019/20Sources: USDA, World Agricultural Outlook Board, World Agricultural Supply and Demand Estimates and ERS calculations.Figure 1Strong second quarter (Q2) use aids in 2019/20 carryout reductionMillion bushelsNext release is February 13, 2020 WHS-20A | January 14, 2020 In this report: - Domestic Outlook - International Outlook 2 Wheat Outlook, WHS-20A, January 14, 2020 USDA, Economic Research Service Domestic Outlook Domestic Changes at a Glance: •The latest USDA, NASS Grain Stocks report indicates higher-than-expecteddisappearance through the first half of the marketing year, as reflected in the newly-issued December 1 stocks estimate.oAt 1,834 million bushels, second quarter ending stocks are about 50 millionbushels lower than previously forecast.•Feed and residual use is increased 10 million bushels on stronger-than-expectedSeptember-November disappearance.•All wheat ending stocks for 2019/20 are lowered 9 million bushels on higher net use.•USDA, NASS reports winter wheat seedings for the 2020/21 marketing year areexpected to total 30.8 million acres, down 1 percent from 2019 (fig. 2).oThe only lower total winter wheat planted area on record was in 1909.•Hard red winter wheat plantings are estimated down 3 percent from 2019, soft red winterwheat sowings are up 8 percent year-to-year, and white winter wheat seeded area isdown 4 percent, relative to last year.•The U.S. season-average farm price is unchanged and remains at $4.55 per bushel.oTo date, approximately 70 percent of the 2019/20 wheat crop has beenmarketed.02040608010012014016018019801983198619891992199519982001200420072010201320162019Winter wheatAll wheatNote: Estimated 2020 all wheat planted area is taken from USDA's Long Term Projections to 2029.Source: USDA, National Agricultural Statistics Service. Quickstats database.Million acresFigure 22020 winter wheat planted area projection follows trend of declining wheat sowings3 Wheat Outlook, WHS-20A, January 14, 2020 USDA, Economic Research Service Table 1 - U.S. wheat supply and utilization at a glance 2019/20 Balance sheet item 2019/20 December 2019/20 January Change from previous month Comments Supply, total May-June Marketing Year (MY) Beginning stocks 1,079.8 1,079.8 0.0 Carry-in from 2018/19 is unchanged. Only a slight third quarter adjustment to 2018/19 durum stocks and no change to carryout were reported in the Grain Stocks report. Production 1,920.1 1,920.1 0.0 Imports 105.0 105.0 0.0 All wheat imports are unchanged, durum imports are lowered 5 million bushels on the slow pace to date while hard red spring imports are raised 5 million. Supply, total 3,104.9 3,104.9 0.0 Demand Food 955.0 955.0 0.0 Seed 61.0 60.0 -1.0 Seed use is lowered on reduced winter wheat planted area for 2020/21. Feed and residual 140.0 150.0 10.0 Feed and residual use is raised on lower-than-expected stocks and correspondingly higher implied use in the second quarter. Domestic, total 1,156.0 1,165.0 9.0 Domestic use is raised net 9 million bushels on lower seed use and higher feed and residual use. Exports 975 975 0 All wheat exports are unchanged this month with a 5 million bushels reduction in hard red winter wheat offset by a 5 million bushel increase in projected durum exports. Use, total 2,131.0 2,140.0 9 Total use is raised on net increased domestic use. Ending stocks 973.9 964.9 -9 Ending stocks lowered on increased use and no change in supply. Season Average Farm Price $4.55 $4.55 0 The season average farm price is unchanged this month and accounts for seasonal price recovery and of 20191/20 wheat marketings to date. Source: USDA, World Agricultural Outlook Board Supply and Demand Estimates. 4 Wheat Outlook, WHS-20A, January 14, 2020 USDA, Economic Research Service NASS Forecasts 2020 Winter Wheat Seedings to be Lowest in 110 yearsBased primarily on ...





发表评论取消回复