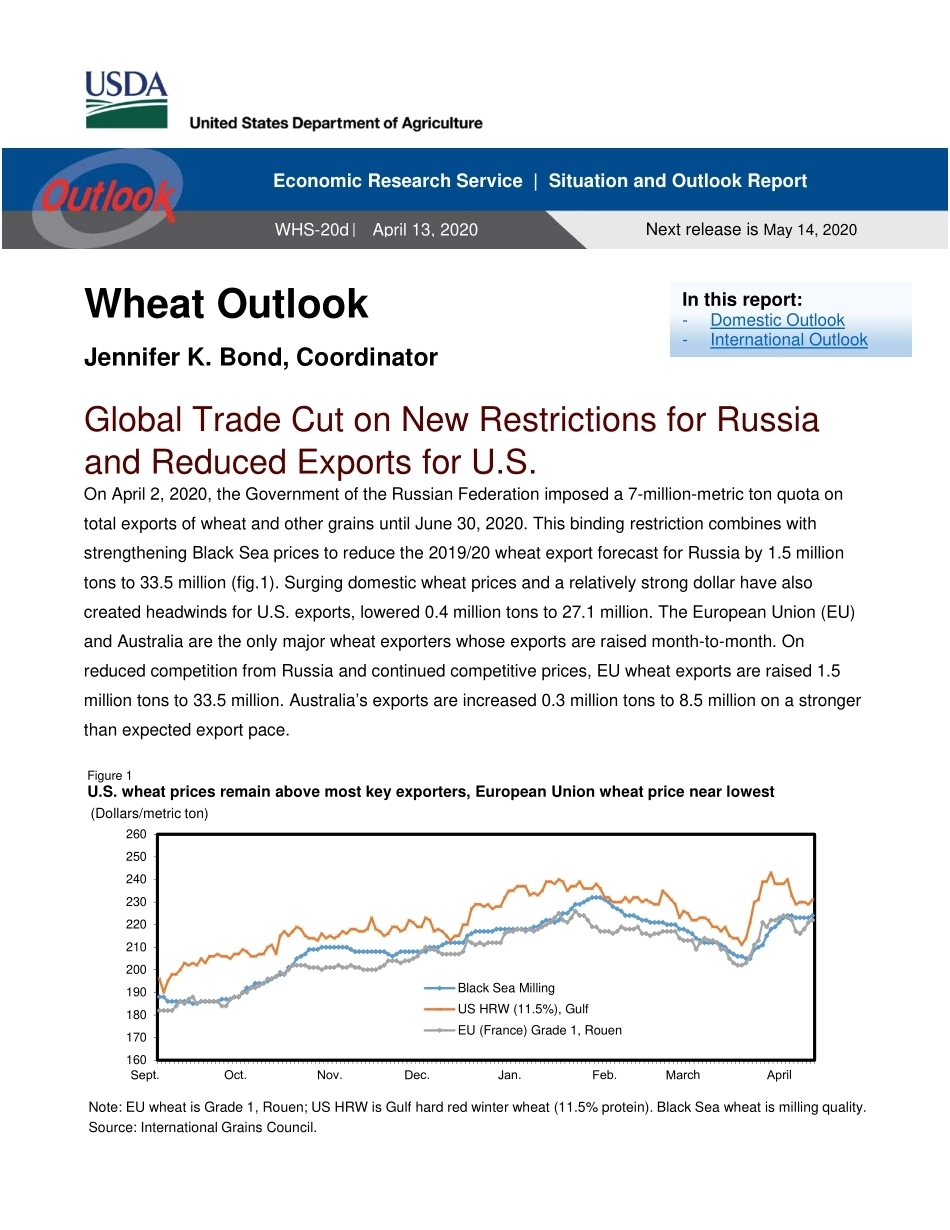
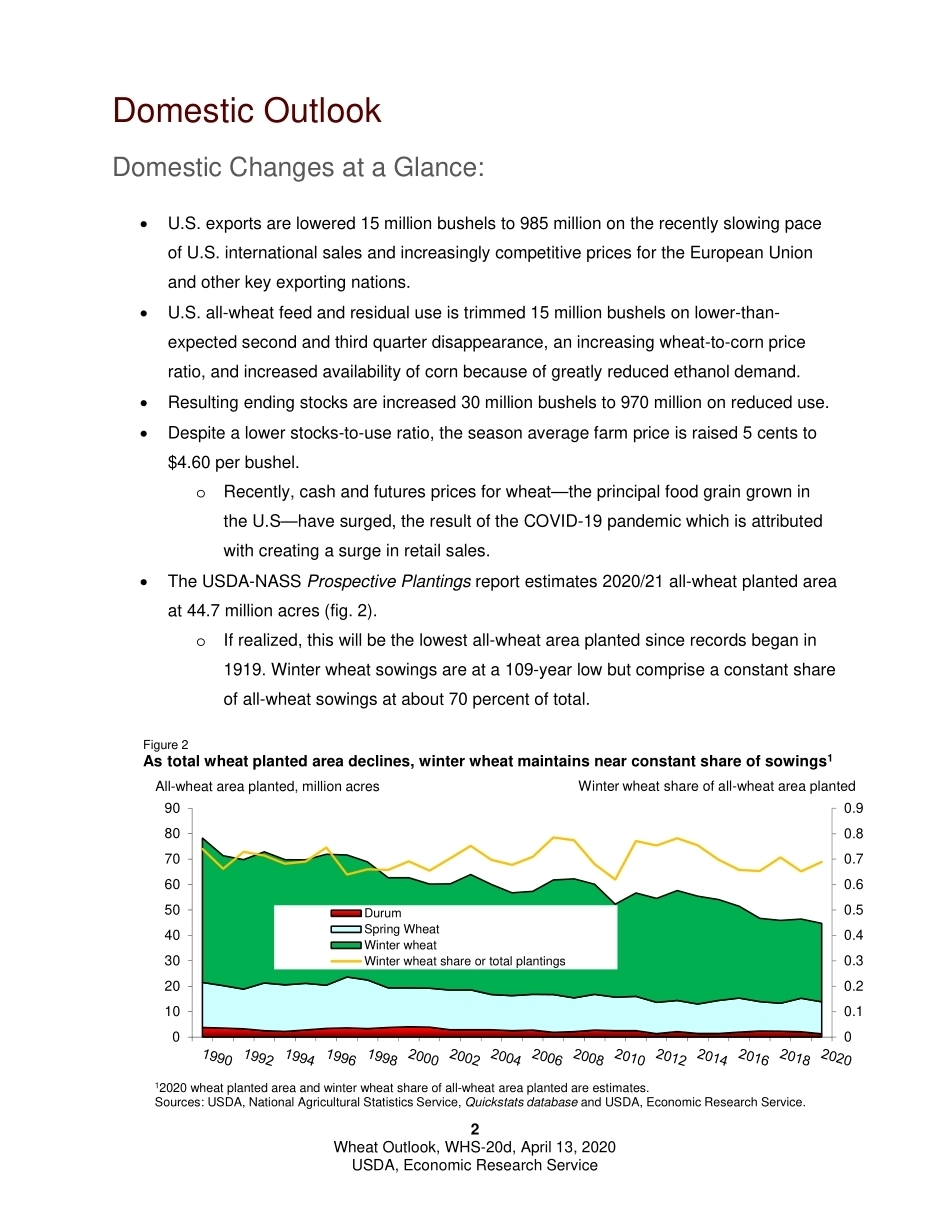
Approved by USDA’s World Agricultural Outlook Board Wheat Outlook Jennifer K. Bond, Coordinator Global Trade Cut on New Restrictions for Russia and Reduced Exports for U.S. On April 2, 2020, the Government of the Russian Federation imposed a 7-million-metric ton quota on total exports of wheat and other grains until June 30, 2020. This binding restriction combines with strengthening Black Sea prices to reduce the 2019/20 wheat export forecast for Russia by 1.5 million tons to 33.5 million (fig.1). Surging domestic wheat prices and a relatively strong dollar have also created headwinds for U.S. exports, lowered 0.4 million tons to 27.1 million. The European Union (EU) and Australia are the only major wheat exporters whose exports are raised month-to-month. On reduced competition from Russia and continued competitive prices, EU wheat exports are raised 1.5 million tons to 33.5 million. Australia’s exports are increased 0.3 million tons to 8.5 million on a stronger than expected export pace. 160170180190200210220230240250260Black Sea MillingUS HRW (11.5%), GulfEU (France) Grade 1, RouenNote: EU wheat is Grade 1, Rouen; US HRW is Gulf hard red winter wheat (11.5% protein). Black Sea wheat is milling quality. Source: International Grains Council.Figure 1U.S. wheat prices remain above most key exporters, European Union wheat price near lowest(Dollars/metric ton)Economic Research Service | Situation and Outlook Report Next release is May 14, 2020 WHS-20d | April 13, 2020 In this report: - Domestic Outlook - International Outlook 2 Wheat Outlook, WHS-20d, April 13, 2020 USDA, Economic Research Service Domestic Outlook Domestic Changes at a Glance: • U.S. exports are lowered 15 million bushels to 985 million on the recently slowing pace of U.S. international sales and increasingly competitive prices for the European Union and other key exporting nations. • U.S. all-wheat feed and residual use is trimmed 15 million bushels on lower-than-expected second and third quarter disappearance, an increasing wheat-to-corn price ratio, and increased availability of corn because of greatly reduced ethanol demand. • Resulting ending stocks are increased 30 million bushels to 970 million on reduced use. • Despite a lower stocks-to-use ratio, the season average farm price is raised 5 cents to $4.60 per bushel. o Recently, cash and futures prices for wheat—the principal food grain grown in the U.S—have surged, the result of the COVID-19 pandemic which is attributed with creating a surge in retail sales. • The USDA-NASS Prospective Plantings report estimates 2020/21 all-wheat planted area at 44.7 million acres (fig. 2). o If realized, this will be the lowest all-wheat area planted since records began in 1919. Winter wheat sowings are at a 109-year low but comprise a constant share of all-wheat sowings at about 70 percent of total. 00.10.20.30.40.50.60.70.80.90102030405060708090DurumSpring WheatWinter wheatWinter wheat share or total plantings12020 wheat planted area and winter wheat share of all-wheat area planted are estimates.Sources: USDA, National Agricultural Statistics Service, Quickstats database and USDA, Economic Research Service. Figure 2 As total wheat planted area declines, winter wheat maintains near constant share of sowings1All-wheat area planted, million acresWinter wheat share of all-wheat area plantedqNqMsQvNzRaQdN7NsQqQoMoOiNoOtPjMrQnR8OrQoQuOtPmNuOrNqM3 Wheat Outlook, WHS-20d, April 13, 2020 USDA, Economic Research Service Table 1 - U.S. wheat supply and utilization at a glance 2019/20 Balance sheet item 2019/20 March 2019/20 April Change from previous month Comments Supply, total May-June Marketing Year (MY) Beginning stocks 1,079.8 1,079.8 0.0 Production 1,920.1 1,920.1 0.0 Imports 105.0 105.0 0.0 Imports are unchanged this month based on the pace of Census imports through February 2020. Supply, total 3,104.9 3,104.9 0.0 Demand Food 955.0 955.0 0.0 Food use remains unchanged as surging retail sales are expected to largely offset declining institutional and restaurant sales. The NASS May 1, Flour Milling Products report will possibly provide clarity on the net effects of COVID-19 related impacts on flour production through the end of March. Seed 60.0 60.0 0.0 Seed use was re-assessed with data on updated NASS winter wheat sowings. Aggregate seed use is unchanged with slight changes across the classes. Feed and residual 150.0 135.0 -15.0 Smaller-than-expected implied second and third quarter disappearance and rising relative wheat prices combined with increasingly abundant corn supplies to reduce demand for wheat feeding (-10 million for HRW and -5 million for SRW). Domestic, total 1,165.0 1,150.0 -15.0 Exports 1,000.0 985.0 -15.0 The recently slowing pace of U.S. wheat exports sales, especially for HRW (-10 million) and SRW (-5 million) led to a 15 million bushel cut. Use, total 2,165.0 2,135.0 -30.0 Reduced feed and residual and lower export use combine to lower total use by 30 million bushels. Ending stocks 939...





发表评论取消回复