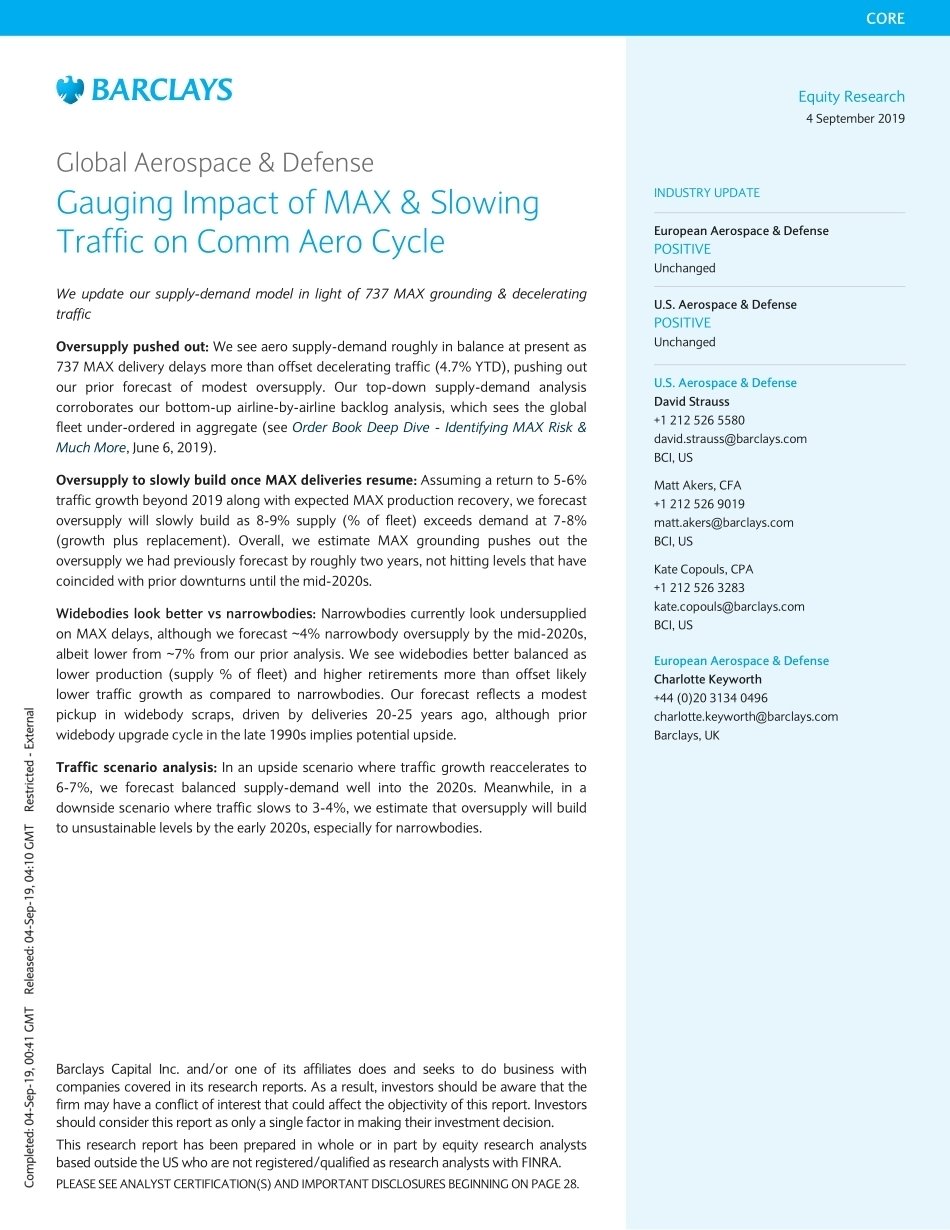
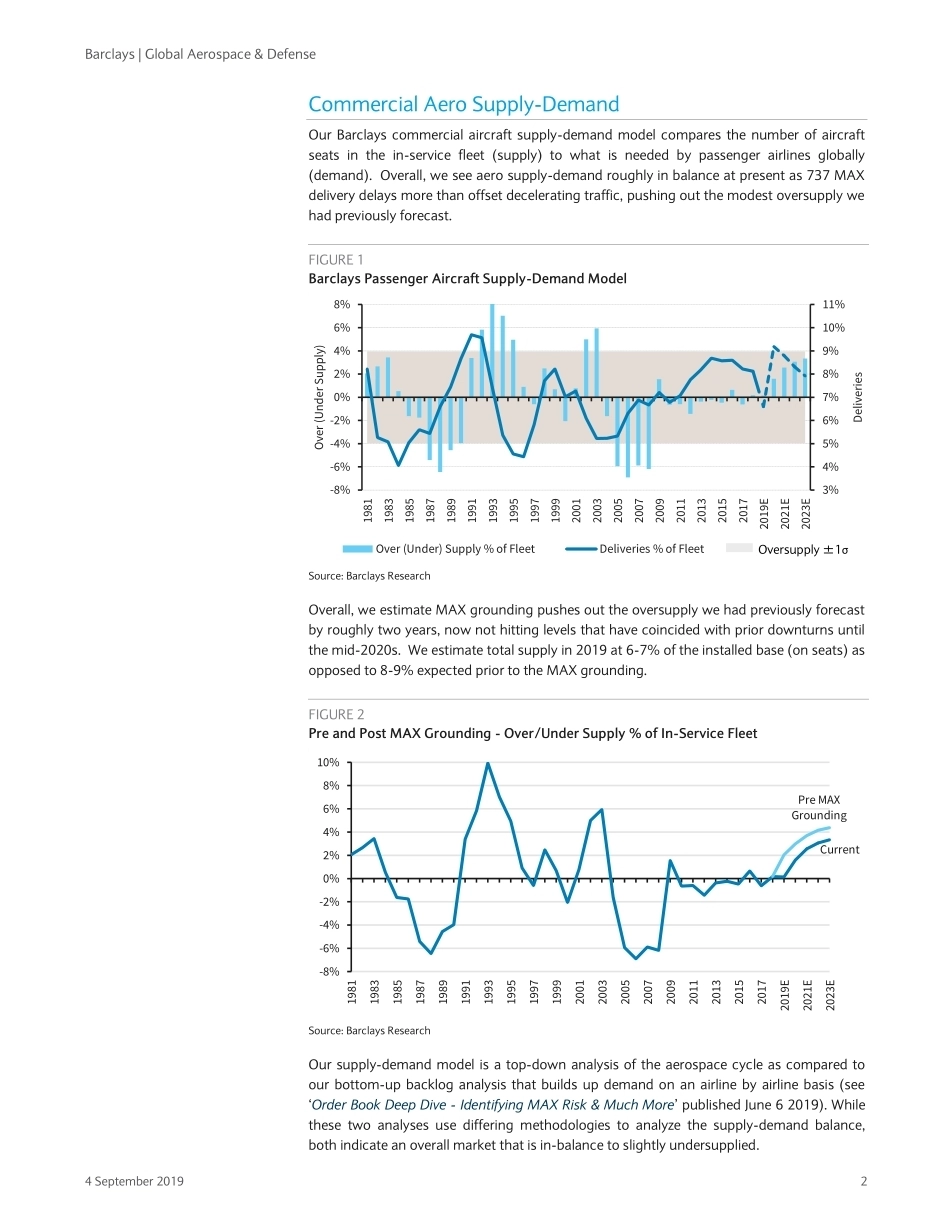
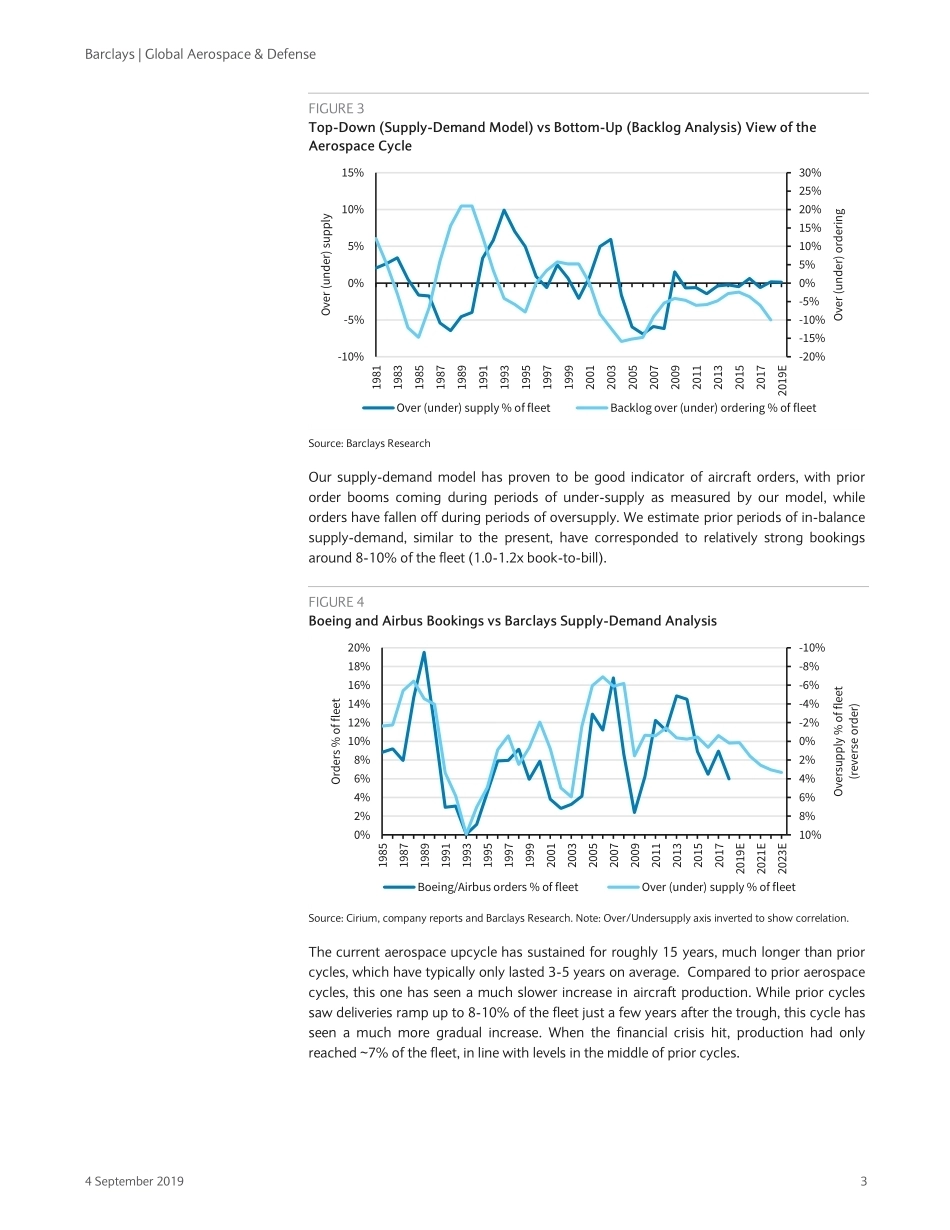
Equity Research 4 September 2019 CORE Barclays Capital Inc. and/or one of its affiliates does and seeks to do business with companies covered in its research reports. As a result, investors should be aware that the firm may have a conflict of interest that could affect the objectivity of this report. Investors should consider this report as only a single factor in making their investment decision. This research report has been prepared in whole or in part by equity research analysts based outside the US who are not registered/qualified as research analysts with FINRA. PLEASE SEE ANALYST CERTIFICATION(S) AND IMPORTANT DISCLOSURES BEGINNING ON PAGE 28. Restricted - Internal Global Aerospace & Defense Gauging Impact of MAX & Slowing Traffic on Comm Aero Cycle We update our supply-demand model in light of 737 MAX grounding & decelerating traffic Oversupply pushed out: We see aero supply-demand roughly in balance at present as 737 MAX delivery delays more than offset decelerating traffic (4.7% YTD), pushing out our prior forecast of modest oversupply. Our top-down supply-demand analysis corroborates our bottom-up airline-by-airline backlog analysis, which sees the global fleet under-ordered in aggregate (see Order Book Deep Dive - Identifying MAX Risk & Much More, June 6, 2019). Oversupply to slowly build once MAX deliveries resume: Assuming a return to 5-6% traffic growth beyond 2019 along with expected MAX production recovery, we forecast oversupply will slowly build as 8-9% supply (% of fleet) exceeds demand at 7-8% (growth plus replacement). Overall, we estimate MAX grounding pushes out the oversupply we had previously forecast by roughly two years, not hitting levels that have coincided with prior downturns until the mid-2020s. Widebodies look better vs narrowbodies: Narrowbodies currently look undersupplied on MAX delays, although we forecast ~4% narrowbody oversupply by the mid-2020s, albeit lower from ~7% from our prior analysis. We see widebodies better balanced as lower production (supply % of fleet) and higher retirements more than offset likely lower traffic growth as compared to narrowbodies. Our forecast reflects a modest pickup in widebody scraps, driven by deliveries 20-25 years ago, although prior widebody upgrade cycle in the late 1990s implies potential upside. Traffic scenario analysis: In an upside scenario where traffic growth reaccelerates to 6-7%, we forecast balanced supply-demand well into the 2020s. Meanwhile, in a downside scenario where traffic slows to 3-4%, we estimate that oversupply will build to unsustainable levels by the early 2020s, especially for narrowbodies. INDUSTRY UPDATE European Aerospace & Defense POSITIVE Unchanged U.S. Aerospace & Defense POSITIVE Unchanged U.S. Aerospace & Defense David Strauss +1 212 526 5580 david.strauss@barclays.com BCI, US Matt Akers, CFA +1 212 526 9019 matt.akers@barclays.com BCI, US Kate Copouls, CPA +1 212 526 3283 kate.copouls@barclays.com BCI, US European Aerospace & Defense Charlotte Keyworth +44 (0)20 3134 0496 charlotte.keyworth@barclays.com Barclays, UK Barclays | Global Aerospace & Defense 4 September 2019 2 Commercial Aero Supply-Demand Our Barclays commercial aircraft supply-demand model compares the number of aircraft seats in the in-service fleet (supply) to what is needed by passenger airlines globally (demand). Overall, we see aero supply-demand roughly in balance at present as 737 MAX delivery delays more than offset decelerating traffic, pushing out the modest oversupply we had previously forecast. FIGURE 1 Barclays Passenger Aircraft Supply-Demand Model Source: Barclays Research Overall, we estimate MAX grounding pushes out the oversupply we had previously forecast by roughly two years, now not hitting levels that have coincided with prior downturns until the mid-2020s. We estimate total supply in 2019 at 6-7% of the installed base (on seats) as opposed to 8-9% expected prior to the MAX grounding. FIGURE 2 Pre and Post MAX Grounding - Over/Under Supply % of In-Service Fleet Source: Barclays Research Our supply-demand model is a top-down analysis of the aerospace cycle as compared to our bottom-up backlog analysis that builds up demand on an airline by airline basis (see ‘Order Book Deep Dive - Identifying MAX Risk & Much More’ published June 6 2019). While these two analyses use differing methodologies to analyze the supply-demand balance, both indicate an overall market that is in-balance to slightly undersupplied. 3%4%5%6%7%8%9%10%11%-8%-6%-4%-2%0%2%4%6%8%19811983198519871989199119931995199719992001200320052007200920112013201520172019E2021E2023EDeliveriesOver (Under Supply)Over (Under) Supply % of FleetDeliveries % of FleetOversupply ±1σCurrentPre MAX Grounding-8%-6%-4%-2%0%2%4%6%8%10%19811983198519871989199119931995199719992001200320052007200920112013201520172019E2021E2023EBarclays | Global Aerospace & Defense 4 September 2019 3 FIGURE 3 Top-Down (Supply-Demand Model) vs Bottom-Up (Backlog Analysis) View of the Aerospace...




发表评论取消回复