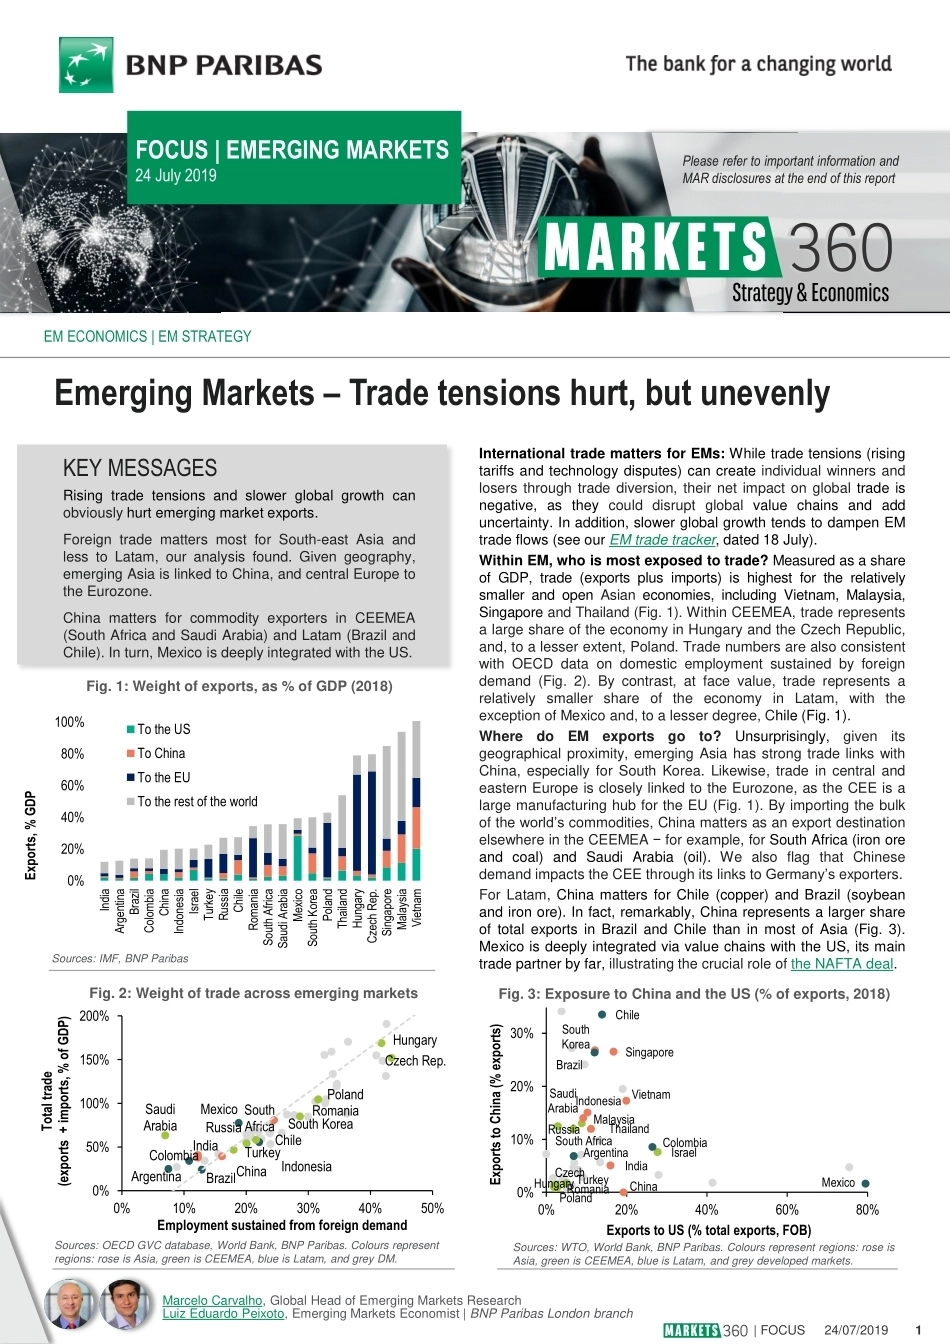
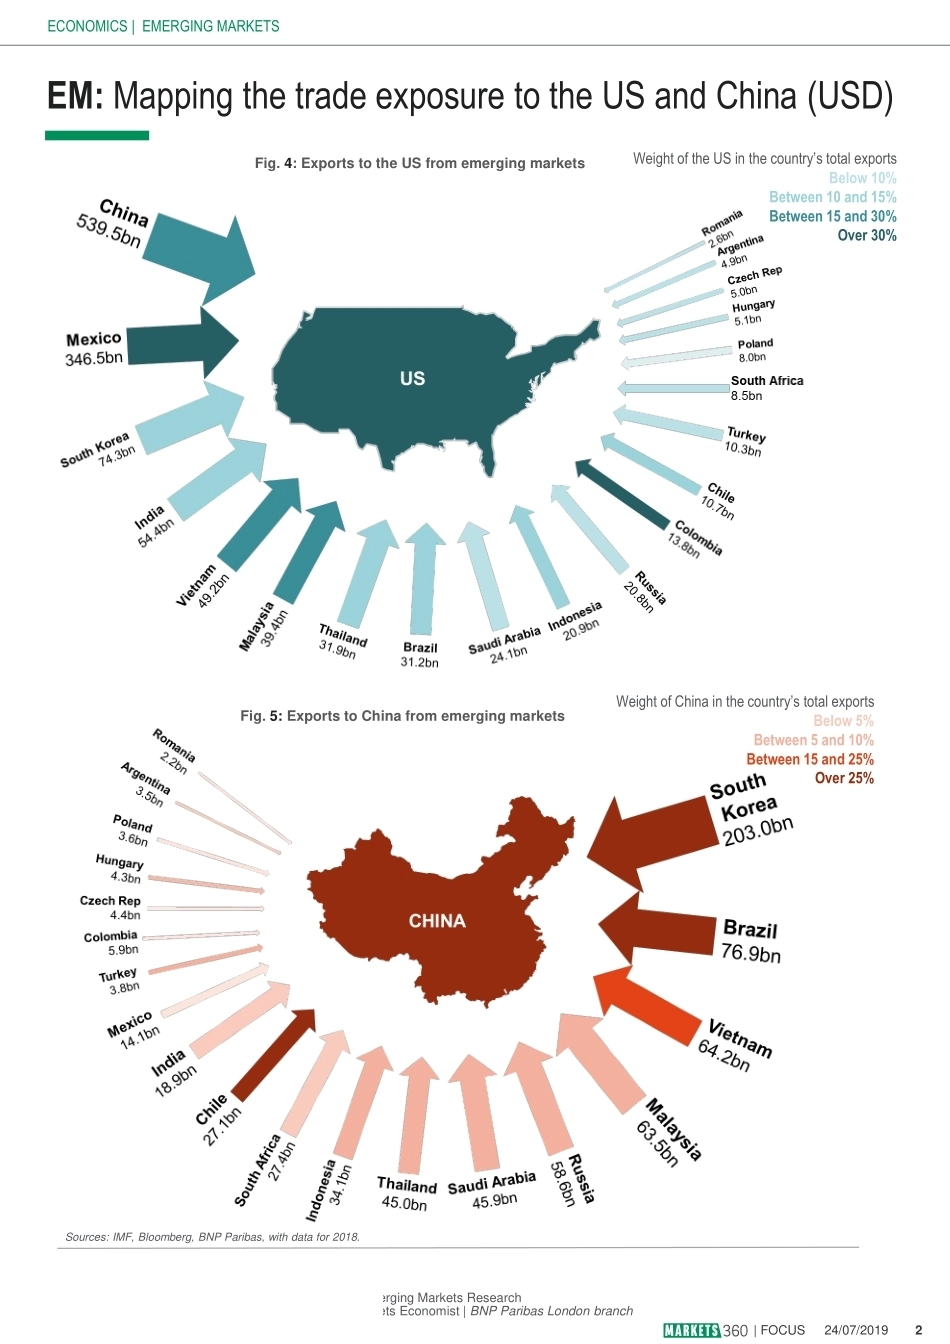
Chile Hungary Czech Israel South Korea Mexico Poland Turkey Argentina Brazil China Colombia India Indonesia Romania Russia Saudi Arabia South Africa Singapore Malaysia Vietnam Thailand 0%10%20%30%0%20%40%60%80%Exports to China (% exports) Exports to US (% total exports, FOB) Chile Czech Rep. Hungary South Korea Mexico Poland Turkey Argentina Brazil ChinaColombia India Indonesia Romania Russia Saudi Arabia South Africa 0%50%100%150%200%0%10%20%30%40%50%Total trade (exports + imports, % of GDP) Employment sustained from foreign demand | FOCUS 24/07/2019 1 EM ECONOMICS | EM STRATEGY FOCUS | EMERGING MARKETS 24 July 2019 Emerging Markets – Trade tensions hurt, but unevenly International trade matters for EMs: While trade tensions (rising tariffs and technology disputes) can create individual winners and losers through trade diversion, their net impact on global trade is negative, as they could disrupt global value chains and add uncertainty. In addition, slower global growth tends to dampen EM trade flows (see our EM trade tracker, dated 18 July). Within EM, who is most exposed to trade? Measured as a share of GDP, trade (exports plus imports) is highest for the relatively smaller and open Asian economies, including Vietnam, Malaysia, Singapore and Thailand (Fig. 1). Within CEEMEA, trade represents a large share of the economy in Hungary and the Czech Republic, and, to a lesser extent, Poland. Trade numbers are also consistent with OECD data on domestic employment sustained by foreign demand (Fig. 2). By contrast, at face value, trade represents a relatively smaller share of the economy in Latam, with the exception of Mexico and, to a lesser degree, Chile (Fig. 1). Where do EM exports go to? Unsurprisingly, given its geographical proximity, emerging Asia has strong trade links with China, especially for South Korea. Likewise, trade in central and eastern Europe is closely linked to the Eurozone, as the CEE is a large manufacturing hub for the EU (Fig. 1). By importing the bulk of the world’s commodities, China matters as an export destination elsewhere in the CEEMEA − for example, for South Africa (iron ore and coal) and Saudi Arabia (oil). We also flag that Chinese demand impacts the CEE through its links to Germany’s exporters. For Latam, China matters for Chile (copper) and Brazil (soybean and iron ore). In fact, remarkably, China represents a larger share of total exports in Brazil and Chile than in most of Asia (Fig. 3). Mexico is deeply integrated via value chains with the US, its main trade partner by far, illustrating the crucial role of the NAFTA deal. Please refer to important information and MAR disclosures at the end of this report Marcelo Carvalho, Global Head of Emerging Markets Research Luiz Eduardo Peixoto, Emerging Markets Economist | BNP Paribas London branch KEY MESSAGES Rising trade tensions and slower global growth can obviously hurt emerging market exports. Foreign trade matters most for South-east Asia and less to Latam, our analysis found. Given geography, emerging Asia is linked to China, and central Europe to the Eurozone. China matters for commodity exporters in CEEMEA (South Africa and Saudi Arabia) and Latam (Brazil and Chile). In turn, Mexico is deeply integrated with the US. Sources: WTO, World Bank, BNP Paribas. Colours represent regions: rose is Asia, green is CEEMEA, blue is Latam, and grey developed markets. Fig. 1: Weight of exports, as % of GDP (2018) Sources: OECD GVC database, World Bank, BNP Paribas. Colours represent regions: rose is Asia, green is CEEMEA, blue is Latam, and grey DM. Fig. 3: Exposure to China and the US (% of exports, 2018) Sources: IMF, BNP Paribas Fig. 2: Weight of trade across emerging markets 0%20%40%60%80%100%IndiaArgentinaBrazilColombiaChinaIndonesiaIsraelTurkeyRussiaChileRomaniaSouth AfricaSaudi ArabiaMexicoSouth KoreaPolandThailandHungaryCzech Rep.SingaporeMalaysiaVietnamExports, % GDP To the USTo ChinaTo the EUTo the rest of the world Weight of China in the country’s total exports Below 5% Between 5 and 10% Between 15 and 25% Over 25% | FOCUS 24/07/2019 2 EM: Mapping the trade exposure to the US and China (USD) ECONOMICS | EMERGING MARKETS Marcelo Carvalho, Global Head of Emerging Markets Research Luiz Eduardo Peixoto, Emerging Markets Economist | BNP Paribas London branch Sources: IMF, Bloomberg, BNP Paribas, with data for 2018. Weight of the US in the country’s total exports Below 10% Between 10 and 15% Between 15 and 30% Over 30% Fig. 4: Exports to the US from emerging markets Fig. 5: Exports to China from emerging markets 3 This document has been written by our Strategist and Economist teams within the BNP Paribas group of companies (collectively “BNPP”); it does not purport to be an exhaustive analysis, and may be subject to conflicts of interest resulting from their interaction with sales and trading which could affect the objectivity of this report. This document is non-independent research for the purpose of the UK Financial Conduct Auth...




发表评论取消回复